
File:Lagrange very simple.svg

Size of this PNG preview of this SVG file: 512 × 452 pixels. Other resolutions: 272 × 240 pixels | 544 × 480 pixels | 870 × 768 pixels | 1,160 × 1,024 pixels | 2,320 × 2,048 pixels.
Original file (SVG file, nominally 512 × 452 pixels, file size: 1.83 MB)
| This is a file from the Wikimedia Commons. Information from its description page there is shown below. Commons is a freely licensed media file repository. You can help. |
Summary
| Description |
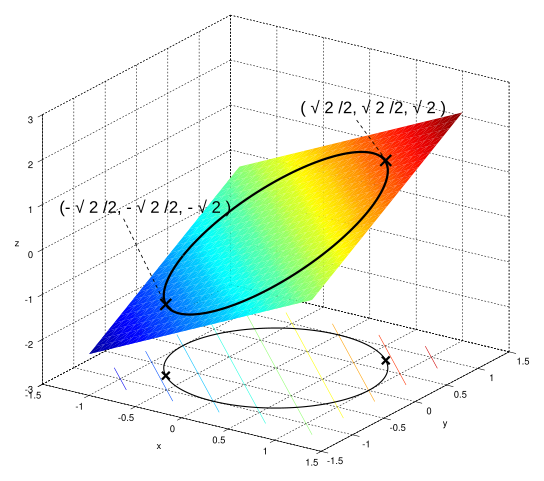
Català: Fig. 2. Il·lustració del problema d'optimització restringida. English: Fig. 3. Illustration of the constrained optimization problem. Italiano: Figura 3. Illustrazione del problema di ottimizzazione vincolata. Nederlands: Afbeelding 3: eenvoudig voorbeeld. Polski: Wykresem funkcji jest płaszczyzna. W przestrzeni trójwymiarowej, równanie opisuje walec (u którego podstawy, na płaszczyźnie leży okrąg jednostkowy). Szukanie ekstremów warunkowych sprowadza się w tym wypadku do badania punktów ekstremalnych części wspólnej walca i płaszczyzny. |
| Date | (UTC) |
| Source |
This file was derived from: Lagrange very simple.jpg: |
| Author |
|
| This is a retouched picture, which means that it has been digitally altered from its original version. Modifications: Vectorization. The original can be viewed here: Lagrange very simple.jpg:
|
Licensing
I, the copyright holder of this work, hereby publish it under the following licenses:
| This file is licensed under the Creative Commons Attribution-Share Alike 3.0 Unported license. | ||
| ||
| This licensing tag was added to this file as part of the GFDL licensing update. |

|
Permission is granted to copy, distribute and/or modify this document under the terms of the GNU Free Documentation License, Version 1.2 or any later version published by the Free Software Foundation; with no Invariant Sections, no Front-Cover Texts, and no Back-Cover Texts. A copy of the license is included in the section entitled GNU Free Documentation License. |
You may select the license of your choice.
Source code
The graph was made in Matlab with the following source code. Corrected in Inkscape
% Function data
[X,Y] = meshgrid(-1.2:0.1:1.2, -1.2:0.1:1.2);
Z = X+Y;

% Constraint data
t = -pi:0.01:pi;
xc = cos(t);
yc = sin(t);
zc = xc+yc;

% Plot graph and 'constraint'
figure();
surfc(X,Y,Z);
hold on;
plot3(xc, yc, zc, 'k', 'LineWidth', 2);
plot3(xc, yc, -3*ones(1,length(t)), 'k', 'LineWidth', 1);
set(1, 'Color', [1 1 1]);
set(1, 'Position', [46 107 767 682]);
% Axis labels
text(0.2, -2.2, -3, 'x');
text(2.0, -.3, -3, 'y');
text(-1.8, -1.5, 0, 'z');

% Annotations of the max and min points
% Point indicating max
plot3(sqrt(2)/2, sqrt(2)/2, 1.45, 'kx', 'MarkerSize', 14, 'LineWidth', 2);
plot3(sqrt(2)/2, sqrt(2)/2, -3, 'kx', 'MarkerSize', 10, 'LineWidth', 2);
text('Interpreter', 'latex', 'String', '$$(\sqrt{2}/2, \sqrt{2}/2, \sqrt{2})$$',...
        'Position', [.0 .3 1.9], 'FontSize', 20);
% Point indicating min
plot3(-sqrt(2)/2, -sqrt(2)/2, -sqrt(2), 'kx', 'MarkerSize', 14, 'LineWidth', 2);
plot3(-sqrt(2)/2, -sqrt(2)/2, -3, 'kx', 'MarkerSize', 10, 'LineWidth', 2);
text('Interpreter', 'latex', 'String', '$$(-\sqrt{2}/2, -\sqrt{2}/2, -\sqrt{2})$$',...
        'Position', [-1.4 -1.0 -1.0], 'FontSize', 20);
hold off

view([34 24]);

%interpolate for improved rendering
shading interp;

%plot2svg must be retrieved from http://www.zhinst.com/blogs/schwizer/
plot2svg;
Original upload log
This image is a derivative work of the following images:
- File:Lagrange_very_simple.jpg licensed with Cc-by-sa-3.0-migrated, GFDL
- 2007-09-20T13:31:36Z Loxley 685x597 (67879 Bytes) {{Information |Description= |Source=The graph was made in Matlab with the following source code % Function data [X,Y] = meshgrid(-1.2:0.01:1.2, -1.2:0.01:1.2); Z = XY; % Constraint data t = -pi:0.01:pi; xc = cos(t); yc = s
Uploaded with derivativeFX
File history
Click on a date/time to view the file as it appeared at that time.
| Date/Time | Thumbnail | Dimensions | User | Comment | |
|---|---|---|---|---|---|
| current | 17:13, 7 August 2012 | | 512 × 452 (1.83 MB) | Zerodamage | == {{int:filedesc}} == {{Information |Description={{ca|Fig. 2. Il·lustració del problema d'optimització restringida.}} {{en|Fig. 3. Illustration of the constrained optimization problem.}} {{it|Figura 3. Illustrazione del problema di ottimizzazione v... |
File usage
The following pages on the English Wikipedia use this file (pages on other projects are not listed):
Global file usage
The following other wikis use this file:
- Usage on cs.wikipedia.org
- Usage on de.wikipedia.org
- Usage on it.wikipedia.org