
File:Map of the annual average discharge of Rhine and Maas 2000-2011 (EN).png
Size of this preview: 737 × 600 pixels. Other resolutions: 295 × 240 pixels | 590 × 480 pixels | 944 × 768 pixels | 1,259 × 1,024 pixels | 2,518 × 2,048 pixels | 2,585 × 2,103 pixels.
Original file (2,585 × 2,103 pixels, file size: 348 KB, MIME type: image/png)
| This is a file from the Wikimedia Commons. Information from its description page there is shown below. Commons is a freely licensed media file repository. You can help. |
| Description |
|
| Date | see file history |
| Source |
Own work, using
|
| Author | Maximilian Dörrbecker (Chumwa) |
| Permission (Reusing this file) |
I, the copyright holder of this work, hereby publish it under the following license: This file is licensed under the Creative Commons Attribution-Share Alike 2.5 Generic license.
Sie dürfen das Bild zu den folgenden Bedingungen nutzen:
|
| Other versions |
|
.png)
.png)
.png)
.png)

.png)

|
This map image could be re-created using vector graphics as an SVG file. This has several advantages; see Commons:Media for cleanup for more information. If an SVG form of this image is available, please upload it and afterwards replace this template with
{{vector version available|new image name}}.
It is recommended to name the SVG file “Map of the annual average discharge of Rhine and Maas 2000-2011 (EN).svg”—then the template Vector version available (or Vva) does not need the new image name parameter. |
File history
Click on a date/time to view the file as it appeared at that time.
| Date/Time | Thumbnail | Dimensions | User | Comment | |
|---|---|---|---|---|---|
| current | 23:08, 6 October 2016 | | 2,585 × 2,103 (348 KB) | Cmdrjameson | Compressed with pngout. Reduced by 225kB (39% decrease). |
| 19:42, 5 March 2016 |  | 2,585 × 2,103 (574 KB) | Chumwa | ||
| 19:03, 3 February 2016 |  | 3,589 × 2,919 (840 KB) | Chumwa | ||
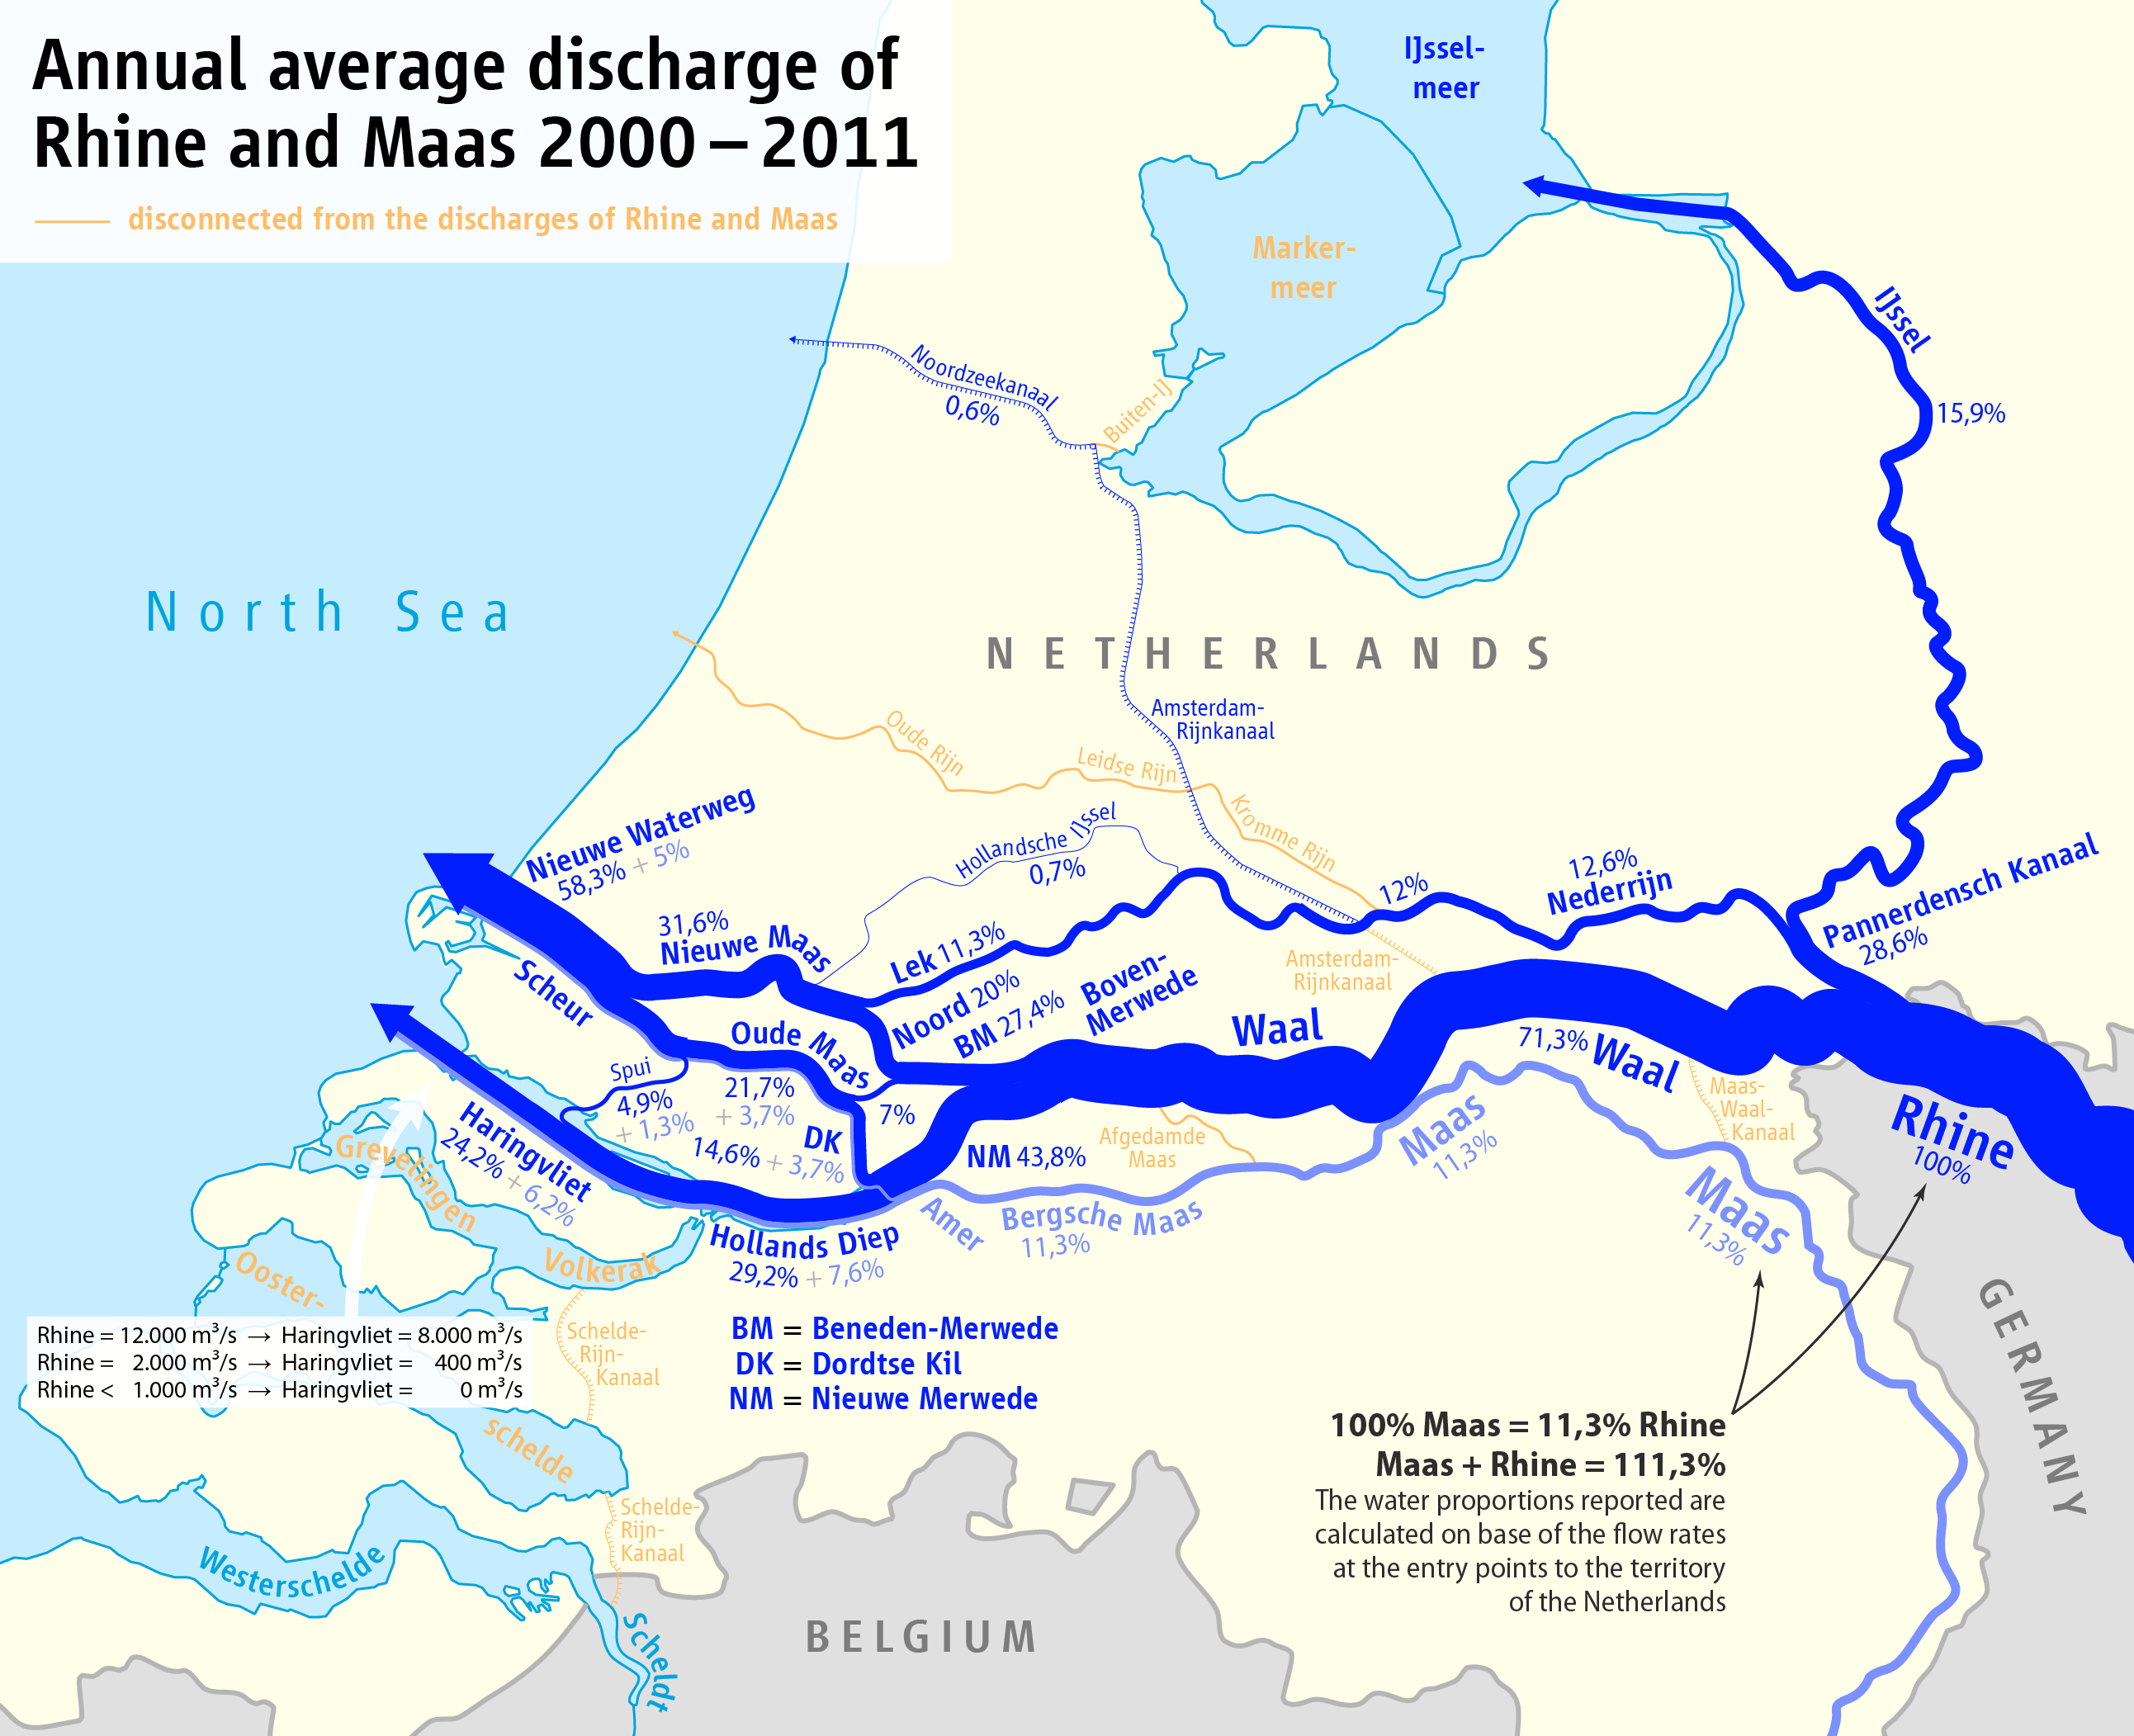
| 06:38, 3 February 2016 |  | 3,589 × 2,919 (840 KB) | Chumwa | {{Information |Description= *{{de|Karte der Aufteilung der Abflüsse im Rhein-Maas-Delta 2000-2011}} *{{en|Map of the partition of Rhine and Meuse water among the various branches of their delta 2000-2011}} |Source={{Own}}, using * [[:File:Netherlands... |
File usage
The following pages on the English Wikipedia use this file (pages on other projects are not listed):
Global file usage
The following other wikis use this file:
- Usage on bg.wikipedia.org
- Usage on da.wikipedia.org
- Usage on de.wikipedia.org
- Usage on en.wiktionary.org
- Usage on es.wikipedia.org
- Usage on eu.wikipedia.org
- Usage on fr.wikipedia.org
- Usage on id.wikipedia.org
- Usage on it.wikipedia.org
- Usage on ru.wikipedia.org
- Usage on sl.wikipedia.org
- Usage on sv.wikipedia.org
- Usage on tr.wikipedia.org
- Usage on uk.wikipedia.org
- Usage on vep.wikipedia.org
- Usage on zh.wikipedia.org
.png)