
File:Pu-phases.png
No higher resolution available.
Pu-phases.png (350 × 441 pixels, file size: 16 KB, MIME type: image/png)
| This is a file from the Wikimedia Commons. Information from its description page there is shown below. Commons is a freely licensed media file repository. You can help. |
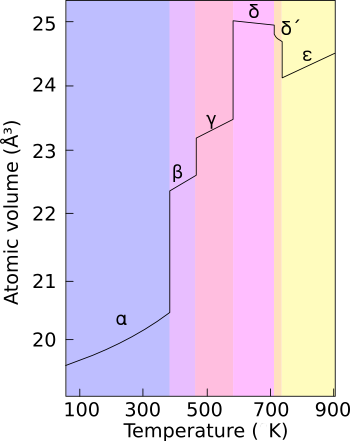
| Description | Phase diagram for plutonium at ambient pressure. The vertical axis is the average atomic volume, in cubic angstroms. |
| Source | Based on the data in the diagram in "Ambient pressure phase diagram of plutonium: A unified theory for α-Pu and δ-Pu" by P. Söderlind in Europhys. Lett., 55 (4), p. 525 (2001). |
| Author | original upload 28 April 2005 by Aarchiba on the English Wikipedia, |
| I, the copyright holder of this work, release this work into the public domain. This applies worldwide. In some countries this may not be legally possible; if so: I grant anyone the right to use this work for any purpose, without any conditions, unless such conditions are required by law. |

|
This chemistry image could be re-created using vector graphics as an SVG file. This has several advantages; see Commons:Media for cleanup for more information. If an SVG form of this image is available, please upload it and afterwards replace this template with
{{vector version available|new image name}}.
It is recommended to name the SVG file “Pu-phases.svg”—then the template Vector version available (or Vva) does not need the new image name parameter. |
File history
Click on a date/time to view the file as it appeared at that time.
| Date/Time | Thumbnail | Dimensions | User | Comment | |
|---|---|---|---|---|---|
| current | 04:37, 23 February 2022 | | 350 × 441 (16 KB) | TSamuel | Lossless filesize recompression via Compress-Or-Die.Com |
| 18:49, 29 January 2019 |  | 350 × 441 (18 KB) | Incnis Mrsi | remade – posterization went bad | |
| 18:46, 29 January 2019 |  | 350 × 441 (3 KB) | Incnis Mrsi | the «°K» notation is deprecated since 1969 | |
| 22:57, 23 February 2009 |  | 350 × 441 (16 KB) | Mahahahaneapneap | Compressed | |
| 16:15, 1 October 2005 |  | 350 × 441 (19 KB) | Saperaud~commonswiki | Phase diagram for plutonium at ambient pressure. The vertical axis is the average atomic volume, in cubic angstroms. Based on the data in the diagram in ''[http://www.edpsciences.org/journal/index.cfm?v_url=epl/full/2001/16/6673/6673.html Ambient pr |
File usage
The following pages on the English Wikipedia use this file (pages on other projects are not listed):
Global file usage
The following other wikis use this file:
- Usage on ar.wikipedia.org
- Usage on da.wikipedia.org
- Usage on el.wikipedia.org
- Usage on fr.wikipedia.org
- Usage on hif.wikipedia.org
- Usage on id.wikipedia.org
- Usage on it.wikipedia.org
- Usage on ja.wikipedia.org
- Usage on jv.wikipedia.org
- Usage on no.wikipedia.org
- Usage on ro.wikipedia.org
- Usage on ru.wikipedia.org
- Usage on th.wikipedia.org
- Usage on uk.wikipedia.org
- Usage on vi.wikipedia.org
- Usage on www.wikidata.org
- Usage on zh.wikipedia.org