
G&T-Seq
G&T-seq (short for single cell genome and transcriptome sequencing) is a novel form of single cell sequencing technique allowing one to simultaneously obtain both transcriptomic and genomic data from single cells, allowing for direct comparison of gene expression data to its corresponding genomic data in the same cell...[1]
Background[edit]
The advent of single-cell sequencing has provided researchers with the tools to resolve genotypically and phenotypically distinct cells within a mixed population.[2] In cases where such heterogeneity is relevant, such as in tumours, this technique enables the study of clonal relationships and tumour evolution.[3] As well, rare cell types and samples otherwise containing low cell numbers, such as in the case of circulating tumour cells, can also be studied in greater detail.[4] However, previous methods of library preparation typically involve the capture of either mRNA or genomic DNA (gDNA), but not both.[5] By simultaneously capturing and sequencing both DNA and RNA through a method called G&T sequencing, researchers are able to obtain sequence information for both genome and transcriptome analysis from single cell libraries, thereby allowing integrated studies involving both networks. As a proof of concept, the authors of G&T-seq demonstrated its ability to acquire both the messenger RNA (mRNA) and genomic DNA (gDNA) by using paramagnetic beads with biotinylated oligo-deoxy-Thymine(dT) primer to separate the polyadenylated (Poly-A) RNA from its gDNA prior to amplification and library preparation. Validation experiments on G&T-seq performed using cell lines with previous sequencing data available show that sequencing coverage, gene expression profile, and DNA copy number profiles were reliably reproduced by G&T sequencing, and that this method was able to call a majority (87%) of all previously annotated single nucleotide variants (SNVs) in these cell lines. The authors have argued on this basis that the process of physically separating mRNA from gDNA did not negatively affect the yield or quality of sequencing data.[1]
Methods[edit]
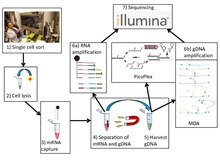
Similar to conventional single-cell sequencing, G&T-seq involves the harvesting and lysis of desired cells. However, both gDNA and polyA-mRNA are captured and physically separated prior to amplification and library construction for analysis using sequencing platforms.
Separation of poly-adenylated RNA from genomic DNA[edit]
G&T sequencing separates the mRNA from the gDNA using an unbiased global amplification procedure described previously.[6] First, mRNA is isolated on specialized oligo-dT (5’-biotin-triethyleneglycol-AAGCAGTGGTATCAACGCAGAGTAC(T)30VN-3’) conjugated to streptavidin-coupled paramagnetic beads.[7] The oligo-dT binds to the poly-A tails of processed mRNA, fishing them out from the pool of genomic material. Next, the paramagnetic beads are spatially isolated by magnetization. The genomic material remaining in the supernatant is extracted and physically separated from the mRNA.[1]
Amplification and Sequencing[edit]
The authors that developed G&T-seq utilized and validated two methods for whole-genome amplification: Multiple displacement amplification and PicoPlex. Other methods, such as MALBAC, may be applicable but have yet to be validated.[1][8]
Multiple Displacement Amplification[edit]
MDA amplification technique can be used to generate long, high quality reads that produce sequencing data of comparable quality to bulk sequencing using PCR amplification.[9] This method involves the use of hexamer primers that bind randomly to the template, followed by DNA elongation using phi29 DNA polymerase. Upon reaching the 5’ end of a downstream primer, the polymerase displaces that elongating strand to continue synthesis. The displaced strand becomes open for pairing with more primers, allowing for amplification of the displaced strand. The process continues and produces a branched DNA library that can be cut and sequenced. The authors of the G&T technique found that, though MDA used in G&T-seq yielded genomic coverage of similar breadth as MDA performed in conventional single cell sequencing, the distribution of read coverage was less even across the genome.[1]
PicoPlex[edit]
Though MDA produces higher quality reads suitable for SNP analysis, DNA copy number profiles generated by such a technique are not highly accurate and reproducible due to its non-uniform amplification.[5][10] An alternate technique called PicoPlex, developed by Rubicon Genomics, has been shown to produce better results.[1] Here, elongation of random primers ligated to an adapter creates a complementary strand with an adapter that, when denatured and randomly reprimed, produces a double stranded fragment with complementary adapters. Denaturation into single strands allows for the formation of hairpin loops due to the complementary nature of their adapters, creating a hairpin loop library that cannot be used for subsequent amplification, thereby preventing exponential amplification of initial bias.[11][12]
cDNA amplification[edit]
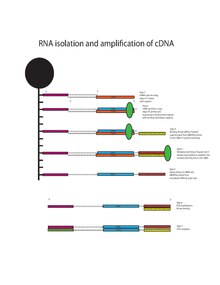
Messenger RNA bound to oligo-dT is reverse transcribed into cDNA using the oligo-dT primers with the addition of Template-Switching Oligo (TSO, 5"-AAGCAGTGGTATCAACGCAGAGTACrGrG+G-3’) and Superscript II reverse transcriptase.[13][14] Superscript II reverse transcriptase has additional terminal transferase activity which adds a variable number of cytosine residues to the end the 3’ terminal cDNA molecule. The overhang of 3’ cytosine residues bind to the TSO, creating an extended template. The Superscript II reverse transcriptase switches templates and continues transcribing to complete the 3’ end of the cDNA. This results in a full length cDNA containing the 5’ oligo-dT primer, cDNA transcribed from mRNA, and the 3’ universal priming site for second-strand synthesis. The cDNA undergoes amplification using the universal primer (5’- AAGCAGTGGTATCAACGCAGAGT-3’) for 18 cycles of PCR before it undergoes library preparation using the Nextera XT Kit from Illumina and sequencing by the Illumina HiSeq platform.[1][15]
Alternatives Techniques[edit]
A similar method to G&T-seq, developed months earlier, is DR-seq (DNA and RNA sequencing). The primary difference between the two techniques is the amplification step, where DNA and polyA-RNA amplification occurs without their prior separation.[16] DR-seq uses random priming, where primers containing a common 27-nucleotide sequence along with a variable 8-nucleotide (ad2 primers) bind to different locations on the cDNA.[12] Despite there being multiple (50-250) primer binding sites on most cDNA, each original (i.e. not the product of amplification/in vitro transcription) cDNA molecule is usually primed only once during the initial amplification step, thus creating a single amplicon of a unique length, containing the ad2 primer on the 5' end. The 3' end contains the ad1 primer, which is the original poly-dT primer used for reverse transcription. This unique amplicon is termed the length-based identifier. Importantly, the length-based identifier is created, but not amplified by this quasilinear PCR step. The number of unique length-based identifiers for each gene can then be used to infer the number of original cDNA (and thus mRNA) molecules present for the gene, providing a method of estimating gene expression that avoids the effect of amplification bias. To further amplify the cDNA for RNA-seq, the cDNA amplicons generated by the original PCR step undergoes in vitro transcription using the T7 promoter incorporated in the ad1 primer to ensure RNA transcripts come from cDNA, not gDNA.
Advantages of the DR-seq technique include the reduction of the possibility for contamination and RNA loss, since the extra step of DNA/RNA separation is skipped. As well, amplification bias is reduced due to the use of the aforementioned length-based identifiers. However, since DNA and polyA-RNA is not separated prior to amplification and subsequent sequencing, the exonic regions must be computationally masked, leaving only reads that originate from gDNA, in order to determine copy number. This creates issues for accurately determining copy number counts from gDNA. The authors note, though, that copy number count over large genomic regions is apparently not impacted by masking as a result because coding regions compose a relatively small portion of the genome.[16]
Applications[edit]
Dual genome and transcriptome sequencing allows researchers to establish high resolution correlations of genomic aberrations with alterations to levels of transcription. For example, the authors of this technique were able to detect single cells with chromosomal aneuploidies, and establish that these aneuploidies corresponded with increased or decreased overall chromosomal gene expression when there was a respective chromosomal gain (e.g. Trisomy) or loss. Subchromosomal changes could also be correlated with changes in expression of genes at affected loci. As well, the authors were able to find a fusion transcript and locate the chromosomal breakpoint in the same cell resulting in the fusion.[1]
G&T-seq also provides a strategy for establishing causative links between genotype and phenotype associations in single cells (e.g. Non-coding SNVs). While bulk sequencing of genome and transcriptome may allow one to associate a collection of genotypic features with mean expression patterns in a population of cells, it overlooks subtle or temporal differences between individual cells that may arise due to cell ecology.[17] This presents an obstacle for researchers trying to pinpoint the genomic causes underlying transcript alterations, especially when compounded with tumour samples where heterogeneity is widespread and background genetic variation could confound relevant mutations.[3][18][19] Conventional single cell sequencing, on the other hand, prevents one from making direct associations between mutations and changes in the transcriptome because either the DNA or the RNA is lost in the process. Traditionally, researchers would have to use other methods, such as classification based on cell markers. However, such methods of discrimination rely on the availability of specific antibodies, and provide relatively coarse discrimination compared to sequencing since expression of cell surface markers constitute only a fraction of its overall phenotype[20][21]
Finally, separation of DNA from RNA paves the way for dual sequencing of the epigenome and transcriptome, two components of the cell that are intricately linked to each other. However, this would require validation with conventional single cell bisulphite sequencing to ensure separation of DNA and RNA doesn’t affect the DNA methylation status.
Considerations[edit]
GC bias[edit]
The MDA amplification has an inherent bias against repeat sequences which were underrepresented in MDA products. In the context of G&T sequencing, this results in a reduced read count as the % of GC content increases for a particular region.
Distribution of read coverage[edit]
Comparing the amplification of single cell residual genomic DNA after mRNA isolation by MDA to amplification of single cell genomic DNA without mRNA isolation by MDA, showed a less evenly distributed coverage across the genome after mRNA isolation. Although there was a reduction in coverage distribution, it was not by a large proportion.
Exclusion of alternate RNA[edit]
Isolation of mRNA by the G&T-seq technique described is only capable of capturing mRNAs which have a sufficient length poly-A tail which can be captured by the oligo-dT bait.[6] This is not a complete representation of the mRNA present in the cell. Some mRNAs have crucial roles in phenotypic expression but do not present the standard polyA tail length due to alternative polyadenylation.[22] Therefore, G&Ts comparison of genotype–phenotype correlation does not necessarily represent the best causal link between the two.
Protein expression correlation[edit]
The mRNA isolation is not the only hurdle in establishing genotype–phenotype relation. It is not sufficient to use mRNA as a surrogate to total protein expression, because other RNA species exist which also play important roles in phenotypic expression. Another auxiliary technique which can bolster the claims made by G&T sequencing is a total proteome analysis by mass spectrometry, giving a better presentation of the relation between genomic changes and phenotypic presentation[15]
References[edit]
- ^ a b c d e f g h Macaulay, I. C.; Haerty, W.; Kumar, P.; Li, Y. I.; Hu, T. X.; Teng, M. J.; Voet, T. (2015). "G&T-seq: Parallel sequencing of single-cell genomes and transcriptomes". Nature Methods. 12 (6): 519–22. doi:10.1038/nmeth.3370. PMID 25915121. S2CID 969246.
- ^ Wang, X. Single Cell Sequencing and Systems Immunology (Vol. 5). Springer
- ^ Xi-Xi Chen, Fan Bai (2015). "Single-cell analyses of circulating tumor cells". 癌症生物学与医学:英文版. 12 (3): 184–192. doi:10.7497/j.issn.2095-3941.2015.0056. PMC 4607822. PMID 26487963.
- ^ a b Grün, D.; van Oudenaarden, A. (2015). "Design and analysis of single-cell sequencing experiments". Cell. 163 (4): 799–810. doi:10.1016/j.cell.2015.10.039. PMID 26544934.
- ^ a b Klein, C. A.; Seidl, S.; Petat-Dutter, K.; Offner, S.; Geigl, J. B.; Schmidt-Kittler, O.; Baeuerle, P. A. (2002). "Combined transcriptome and genome analysis of single micrometastatic cells". Nature Biotechnology. 20 (4): 387–92. doi:10.1038/nbt0402-387. PMID 11923846. S2CID 22474647.
- ^ Picelli, S.; Faridani, O. R.; Björklund, Å. K.; Winberg, G.; Sagasser, S.; Sandberg, R. (2014). "Full-length RNA-seq from single cells using Smart-seq2". Nature Protocols. 9 (1): 171–81. doi:10.1038/nprot.2014.006. PMID 24385147. S2CID 20439681.
- ^ Chapman, A. R.; He, Z.; Lu, S.; Yong, J.; Tan, L.; Tang, F.; Xie, X. S. (2015). "Single cell transcriptome amplification with MALBAC". PLOS ONE. 10 (3): e0120889. Bibcode:2015PLoSO..1020889C. doi:10.1371/journal.pone.0120889. PMC 4378937. PMID 25822772.
- ^ Blanco, L.; Bernad, A.; Lázaro, J. M.; MartÃn, G.; Garmendia, C.; Salas, M. (1989). "Highly efficient DNA synthesis by the phage phi 29 DNA polymerase. Symmetrical mode of DNA replication". Journal of Biological Chemistry. 264 (15): 8935–8940. doi:10.1016/S0021-9258(18)81883-X. PMID 2498321.
- ^ Voet, T.; Kumar, P.; Van Loo, P.; Cooke, S. L.; Marshall, J.; Lin, M.; Campbell, P. J. (2013). "Single-cell paired-end genome sequencing reveals structural variation per cell cycle". Nucleic Acids Research. 41 (12): 6119–6138. doi:10.1093/nar/gkt345. PMC 3695511. PMID 23630320.
- ^ "PGS/PGD." Rubicon Genomics. N.p., n.d. Web. 25 Feb. 2016
- ^ a b Zong, C.; Lu, S.; Chapman, A. R.; Xie, X. S. (2012). "Genome-wide detection of single-nucleotide and copy-number variations of a single human cell" (PDF). Science. 338 (6114): 1622–1626. Bibcode:2012Sci...338.1622Z. doi:10.1126/science.1229164. PMC 3600412. PMID 23258894.
- ^ Goetz, J. J.; Trimarchi, J. M. (2012). "Transcriptome sequencing of single cells with Smart-Seq". Nature Biotechnology. 30 (8): 763–765. doi:10.1038/nbt.2325. PMID 22871714. S2CID 10977972.
- ^ "Nextera XT DNA Library Preparation Kit." Nextera XT DNA Library Prep Kit. N.p., n.d. Web. 25 Feb. 2016.
- ^ a b Maier, T.; Güell, M.; Serrano, L. (2009). "Correlation of mRNA and protein in complex biological samples". FEBS Letters. 583 (24): 3966–3973. doi:10.1016/j.febslet.2009.10.036. PMID 19850042.
- ^ a b Dey, S. S.; Kester, L.; Spanjaard, B.; Bienko, M.; van Oudenaarden, A. (2015). "Integrated genome and transcriptome sequencing of the same cell". Nature Biotechnology. 33 (3): 285–289. doi:10.1038/nbt.3129. PMC 4374170. PMID 25599178.
- ^ Shapiro, E.; Biezuner, T.; Linnarsson, S. (2013). "Single-cell sequencing-based technologies will revolutionize whole-organism science". Nature Reviews Genetics. 14 (9): 618–630. doi:10.1038/nrg3542. PMID 23897237. S2CID 500845.
- ^ Xu, X.; Hou, Y.; Yin, X.; Bao, L.; Tang, A.; Song, L.; He, W. (2012). "Single-cell exome sequencing reveals single-nucleotide mutation characteristics of a kidney tumor". Cell. 148 (5): 886–895. doi:10.1016/j.cell.2012.02.025. PMC 7458411. PMID 22385958.
- ^ Patel, A. P.; Tirosh, I.; Trombetta, J. J.; Shalek, A. K.; Gillespie, S. M.; Wakimoto, H.; Louis, D. N. (2014). "Single-cell RNA-seq highlights intratumoral heterogeneity in primary glioblastoma". Science. 344 (6190): 1396–1401. Bibcode:2014Sci...344.1396P. doi:10.1126/science.1254257. PMC 4123637. PMID 24925914.
- ^ Vaughan, Christopher. "New Way to Sort Cells without Limitations of Traditional Methods." News Center. Stanford Medicine, 30 Mar. 2015. Web. 25 Feb. 2016
- ^ Bidlingmaier, S.; Zhu, X.; Liu, B. (2008). "The utility and limitations of glycosylated human CD133 epitopes in defining cancer stem cells". Journal of Molecular Medicine. 86 (9): 1025–1032. doi:10.1007/s00109-008-0357-8. PMC 2585385. PMID 18535813.
- ^ De Klerk, E.; AC; Hoen, P. (2015). "Alternative mRNA transcription, processing, and translation: insights from RNA sequencing". Trends in Genetics. 31 (3): 128–139. doi:10.1016/j.tig.2015.01.001. PMID 25648499.