
Gmina Połaniec
Gmina Połaniec
Połaniec Commune | |
|---|---|
 Flag  Coat of arms | |
 | |
| Coordinates (Połaniec): 50°25′48.95″N 21°17′05.69″E / 50.4302639°N 21.2849139°E | |
| Country | |
| Voivodeship | Świętokrzyskie |
| County | Staszów |
| Seat | Połaniec |
| Area (through the years 2006–2010)[1] | |
| • Total | 75.01 km2 (28.96 sq mi) |
| Population (31 December 2010 at Census)[1] | |
| • Total | 11,848 |
| • Density | 160/km2 (410/sq mi) |
| • Urban | 8,227 |
| • Rural | 3,621 |
| Time zone | UTC+1 (CET) |
| • Summer (DST) | UTC+2 (CEST) |
| Postal code | 28–230 |
| Area code | +48 15 |
| Car plates | TSZ |
| Website | http://www.polaniec.pl/ |
Gmina Połaniec[2][3] is an urban-rural gmina (administrative district) in Staszów County, Świętokrzyskie Voivodeship, in south-central Poland. Its seat is the town of Połaniec, which lies approximately 17 kilometres (11 mi) south-east of Staszów and 69 km (43 mi) south-east of the regional capital Kielce.
The gmina covers an area of 75.01 square kilometres (29.0 sq mi), and as of 2010 its total population is ![]() 11,848 (out of which the population of Połaniec amounts to
11,848 (out of which the population of Połaniec amounts to ![]() 8,227, and the population of the rural part of the gmina is
8,227, and the population of the rural part of the gmina is ![]() 3,621).
3,621).
Demography[edit]
According to the 2011 Poland census, there were 11,848 people residing in Połaniec Commune, of whom 49.8% were male and 50.2% were female (out of which the population in rural areas amounts to 3,621, of whom 50.4% were male and 49.6% were female). In the commune, the population was spread out, with 19.1% under the age of 18, 40.6% from 18 to 44, 29% from 45 to 64, and 11.2% who were 65 years of age or older (out of which the population in rural areas amounts to 20.4% under the age of 18, 40.1% from 18 to 44, 22.5% from 45 to 64, and 17.0% who were 65 years of age or older).[1]
Table 1. Population level of commune in 2010 – by age group[1] SPECIFICATION Measure
unitPOPULATION
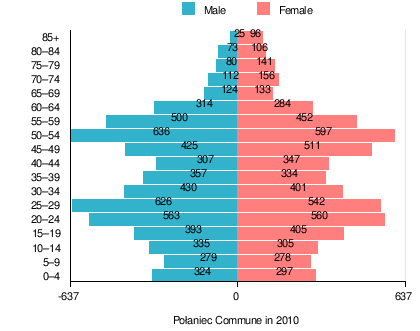
(by age group in 2010)TOTAL 0–4 5–9 10–14 15–19 20–24 25–29 30–34 35–39 40–44 45–49 50–54 55–59 60–64 65–69 70–74 75–79 80–84 85 + I. TOTAL person 11,848 621 557 640 798 1,123 1,168 831 691 654 936 1,233 952 598 257 268 221 179 121 — of which in % 100 5.2 4.7 5.4 6.7 9.5 9.9 7 5.8 5.5 7.9 10.4 8 5 2.2 2.3 1.9 1.5 1 1. BY SEX A. Males person 5,903 324 279 335 393 563 626 430 357 307 425 636 500 314 124 112 80 73 25 — of which in % 49.8 2.7 2.4 2.8 3.3 4.8 5.3 3.6 3 2.6 3.6 5.4 4.2 2.7 1 0.9 0.7 0.6 0.2 B. Females person 5,945 297 278 305 405 560 542 401 334 347 511 597 452 284 133 156 141 106 96 — of which in % 50.2 2.5 2.3 2.6 3.4 4.7 4.6 3.4 2.8 2.9 4.3 5 3.8 2.4 1.1 1.3 1.2 0.9 0.8
Table 2. Population level in rural areas in 2010 – by age group[1] SPECIFICATION Measure
unitPOPULATION
(by age group in 2010)TOTAL 0–4 5–9 10–14 15–19 20–24 25–29 30–34 35–39 40–44 45–49 50–54 55–59 60–64 65–69 70–74 75–79 80–84 85 + I. TOTAL person 3,621 187 202 198 261 303 326 257 226 229 241 269 217 179 116 148 97 106 59 — of which in % 100 5.2 5.6 5.5 7.2 8.4 9 7.1 6.2 6.3 6.7 7.4 6 4.9 3.2 4.1 2.7 2.9 1.6 1. BY SEX A. Males person 1,825 104 113 103 136 159 162 141 113 111 121 157 122 88 50 58 34 38 15 — of which in % 50.4 2.9 3.1 2.8 3.8 4.4 4.5 3.9 3.1 3.1 3.3 4.3 3.4 2.4 1.4 1.6 0.9 1 0.4 B. Females person 1,796 83 89 95 125 144 164 116 113 118 120 112 95 91 66 90 63 68 44 — of which in % 49.6 2.3 2.5 2.6 3.5 4 4.5 3.2 3.1 3.3 3.3 3.1 2.6 2.5 1.8 2.5 1.7 1.9 1.2
Table 3. Population level of commune in 2010 – by sex[1] SPECIFICATION Measure
unitPOPULATION
(by sex in 2010)TOTAL Males Females I. TOTAL person 11,848 5,903 5,945 — of which in % 100 49.8 50.2 1. BY AGE GROUP A. At pre-working age person 2,268 1,155 1,113 — of which in % 19.1 9.7 9.4 B. At working age. grand total person 8,250 4,334 3,916 — of which in % 69.6 36.6 33 a. at mobile working age person 4,815 2,459 2,356 — of which in | % 40.6 20.8 19.8 b. at non-mobile working age person 3,435 1,875 1,560 — of which in | % 29 15.8 13.2 C. At post-working age person 1,330 414 916 — of which in % 11.2 3.5 7.7
Table 4. Population level in rural areas in 2010 – by sex[1] SPECIFICATION Measure
unitPOPULATION
(by sex in 2010)TOTAL Males Females I. TOTAL person 3,621 1,825 1,796 — of which in % 100 50.4 49.6 1. BY AGE GROUP A. At pre-working age person 738 396 342 — of which in % 20.4 10.9 9.4 B. At working age. grand total person 2,266 1,234 1,032 — of which in % 62.6 34.1 28.5 a. at mobile working age person 1,451 746 705 — of which in | % 40.1 20.6 19.5 b. at non-mobile working age person 815 488 327 — of which in | % 22.5 13.5 9 C. At post-working age person 617 195 422 — of which in % 17 5.4 11.7

Villages[edit]
Apart from the town of Połaniec, Gmina Połaniec contains the villages and settlements of Brzozowa, Kamieniec, Kraśnik, Łęg, Luszyca, Maśnik, Okrągła, Rudniki, Ruszcza, Ruszcza-Kępa, Rybitwy, Tursko Małe, Tursko Małe-Kolonia, Winnica, Wymysłów, Zawada, Zdzieci Nowe, Zdzieci Stare and Zrębin.
Neighbouring gminas[edit]
Gmina Połaniec is bordered by the gminas of Borowa, Gawłuszowice, Łubnice, Osiek and Rytwiany.
References[edit]
- ^ a b c d e f g h i "Local Data Bank (Bank Danych Lokalnych) – Layout by NTS nomenclature (Układ wg klasyfikacji NTS)". demografia.stat.gov.pl: GUS. 10 March 2011.
- ^ "Połaniec – miasto, gmina, powiat staszowski, województwo świętokrzyskie" [Połaniec – urban area, commune, Staszów County, Świętokrzyskie Province, Poland]. Topographical map prepared in 1:10,000 scale. Aerial and satellite orthophotomap (in Polish). Head Office of Geodesy and Cartography, Poland, Warsaw. 2011. geoportal.gov.pl. Archived from the original on 21 December 2012. Retrieved 27 April 2011.
- ^ "Połaniec – obszar wiejski, gmina, powiat staszowski, województwo świętokrzyskie" [Połaniec – rural area, commune, Staszów County, Świętokrzyskie Province, Poland]. Topographical map prepared in 1:10,000 scale. Aerial and satellite orthophotomap (in Polish). Head Office of Geodesy and Cartography, Poland, Warsaw. 2011. geoportal.gov.pl. Archived from the original on 21 December 2012. Retrieved 27 April 2011.
External links[edit]
| Town and seat | | ||||
|---|---|---|---|---|---|
| Parts of town |
| ||||
| Villages |
| ||||
| Part of village |
| ||||
| Colonies |
| ||||
| Farmstead |
| ||||
| Smaller locality | |||||
| Seat |  | |
|---|---|---|
| Urban-rural gminas | ||
| Rural gminas | ||