
Wikipedia:Featured picture candidates/The fluorine economy
The fluorine economy[edit]
Voting period is over. Please don't add any new votes. Voting period ends on 11 Jan 2012 at 03:38:20 (UTC)
- Reason
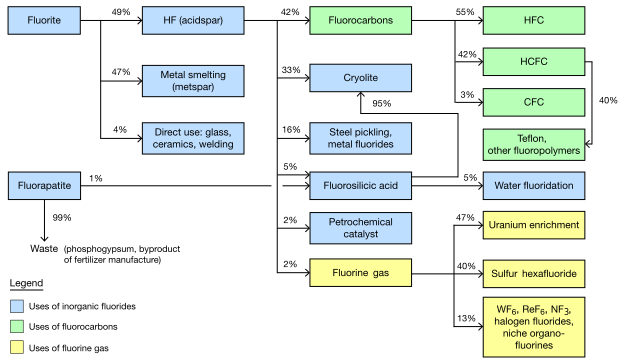
- EV (supports major section in notable article headed to FAC). Illustrative value (helpful reference for discussion that would otherwise be confusing in terms of intermediates). Innovation (common in outside world, but I don't see industries shown this way in Wiki much). Collaboration/development (working with graphic helped write content and visa versa: pushed the quality of each as mistakes were found/fixed by the interaction).
- Articles in which this image appears
- Fluorine
- FP category for this image
- Wikipedia:Featured pictures/Diagrams, drawings, and maps/Diagrams
- Creator
- Fallschirmjäger
- Support as nominator --TCO (Reviews needed) 03:38, 2 January 2012 (UTC)
- Support with a possible amendment. Really nice summary of an important area of technology that is largely hidden from sight. Suggestion: the scheme defines "major uses" in kilograms, which is not the same as impact. It may be useful to remind readers that 25%? (TCO would know) of all pharmaceuticals contain F (and a lot of herbicides now too). I think that these compounds are made (via reagents) from HF, but the amounts in kg are probably tiny (even though some people seem to consume a lot of Prozac). One of our experts on pharmaceuticals is User:Edgar181. Also the scheme should have a year for which these data apply (2012, I guess). --Smokefoot (talk) 04:34, 2 January 2012 (UTC)
 Done. Added year (2003) and volume clarification. I prefer to keep the pharma out of this one diagram since they are small in F volume and since, we treat them in a different section ("Biological aspects"). The diagram is like a header for a section (and drugs are in a different section). I will research that and improve pharma part too, though. P.s. I did follow up with Edgar (thanks)! P.s.s. SF4 is the agent for most pharma fluorinations (gentler fluorinator).TCO (Reviews needed) 04:56, 2 January 2012 (UTC)
- Comment Why isn't there a percentage on HCFC to Teflon, ...? JJ Harrison (talk) 06:07, 2 January 2012 (UTC)
- Done.Added number and new ref. TCO (Reviews needed) 14:23, 2 January 2012 (UTC)
- Support While it isn't the most technical diagram, its simplicity and place in the article is invaluable to helping the reader visualize clearly what is being explained in the text. Fallschirmjäger ✉ 11:47, 2 January 2012 (UTC)
- One more thing - I could not divine the meaning of the arrow going down to "waste". The point being that only 1% of the F content of fluoroapatite is discarded? As what? Or is it left in the H3PO4 stream? --Smokefoot (talk) 13:57, 2 January 2012 (UTC)
- Done. Added note to help explain this (agree with crit). P.s. It goes into phosphogypsum, but that product is too hazardous (not from F, but other nasties) to use in any gypsum uses so it is a total waste.TCO (Reviews needed) 14:23, 2 January 2012 (UTC)
- Comment: Could the default size be a little larger? Perhaps as large as it is here? Also, why "Fluorine Gas" and "Sulfur Hexafluoride"? Also, I'm concerned about the use of an image for what could perhaps using wikimarkup- that's an accessibility issue, and something about which comments are often made at the likes of FAC and GAC. (The same thing's true with tables, family trees and so on. If there's markup for it, then an image shouldn't be used, ideally.) J Milburn (talk) 15:25, 2 January 2012 (UTC)
- Capitalization and default size Done.TCO (Reviews needed) 15:41, 2 January 2012 (UTC)
- I do not support changing this to a table. You lose a lot of process flow insight. Also, this is not shown as a table in main reference (they use a similar arrow style diagram in the journal published article, although ours is much better laid out, really it is). Likelihood of changes or updates is very low (have to redo the whole thing really) and I don't want people editing the table values. In terms of access, the colors are discernabley different in black and white mode (although yellow-blue color blindness?) For totally blind people, I could "alt in" a table (I would not want to degrade the experience for sighted viewers so that would be the workaround), but really, I wonder about their reading experience with tables anyhow, since you can't scan by eye, but have to hear it all. (And, dim memory, I think I recall hearing that they hate tables because they hear a lot of syntax notes for all the formatting.) And they are missing details of photographic images also. And there is a fair amount of discussion in text related to the graphic (so they get the gist). That said, there is one blind reader, Johnbod and we could ask him if you want. I really think this is good though. I mean we could cut the whole thing...but then you are really just taking away from the sighted because the blind can't appreciate it.TCO (Reviews needed) 15:41, 2 January 2012 (UTC)
- I wouldn't want to change it to a table- I like the current formatting, I was just wondering if flow-charts could be achieved in wikimarkup. I'm not actually sure if they can, now I think about it... If they can't, then I'd be happy to support, provided this is accurate. J Milburn (talk) 16:07, 2 January 2012 (UTC)
- Capitalization and default size
- Comment: Could we shoehorn the caption (date of sources) into the image. Too often image reusers fail to note these details, leading to badly outdated charts with no way to notice that they aren't current. Rmhermen (talk) 23:36, 2 January 2012 (UTC)
- Done.
- Comment: I've added a version with an imagemap and clickable links under the original file. Fallschirmjäger ✉ 22:13, 3 January 2012 (UTC)
- For what it is worth, for the voters, there was thought put into each link (what the best article or section to send someone to). I don't know if it makes a difference in terms of original/new voting and all that, but the revised version is going into article! It's your only choice. ;) And the imagemap info is going into the commons version (another language would have to change the wikilinks, but at least we give them the coordinates. TCO (Reviews needed) 22:51, 3 January 2012 (UTC)
- Comment Another minor nitpick - not all of the lines on the box borders are of the same width at the thumbnail size. JJ Harrison (talk) 20:53, 7 January 2012 (UTC)
- Comment The italic text is difficult to read in the article. I would suggest either increasing the font size or increasing the image size. Kaldari (talk) 06:19, 8 January 2012 (UTC)
- We'll fix. I'll tighten prose to help the process!TCO (Reviews needed) 19:41, 8 January 2012 (UTC)
- Fixed. Fallschirmjäger ✉ 17:32, 9 January 2012 (UTC)
- Support I'm happy. This is a good example as to why we prefer svg for this sort of stuff. JJ Harrison (talk) 23:15, 8 January 2012 (UTC)
- Support. J Milburn (talk) 23:58, 9 January 2012 (UTC)
- Oppose basically with the all reasonings I had with the Manhattan Project clickable site map nomination. Are we voting for (1) just the diagram, (2) the super-dooper look-at-what-I-can-do image mapping, or (3) both as a single, functional entity? The nomination statement really should be clear about that. Whichever one it is, I'm not sure any are suitable for FP.
- (1) The file is very basic, even though it may be entirely accurate and encyclopedic.
- (2) There's nothing about image mapping that (to borrow wording from FAC/FLC) "exemplifies our very best work". TCO, you replied to me in the Manhattan Project nom that captions are a part of the WP:FP? even though they're not a part of the actual file. And yes, the code for mapping is also written into the article, but captions are a part of the criteria, and mapping isn't. Second, captions are supposed to be descriptive, and informative. That takes a bit of thought, but it's simple to produce an image map (I've done tons for Wikiproject Skyscrapers), especially with the Toolserver app. No special knowledge is needed; it's just a matter of clicking and selecting the correct coordinates, and when those coordinates are for oblongs it's an even easier process. Anyway, since an image map isn't a caption, the mapping has nothing to do with FPC.
- (3) If we're supposed to review it as a functional entity, because of (2) I'm finding it difficult to do that. Also, the clickable links point to articles that are already Wikilinked within the article's prose, so where's the additional EV that the mapping gives the file?
- Definitely we should be looking into using interactive images at Wikipedia, but at the Featured picture level at least, adding text to the article to achieve that isn't the way to go. Additionally, this particular type of mapping is a bit archaic now. Our blind users and their screenreaders come to a screeching halt when they hit the coding. There are newer ways of doing it where this doesn't happen and the folk at WT:ACCESS have more details on them, and it's those ways that, if we ever did include them as part of the FP?, should be highlighted instead. As J Milburn said at the Manhattan Project nom, the coding used here is not appropriate subject matter for FPC. Matthewedwards : Chat 19:03, 10 January 2012 (UTC)
- I'm fine with the oppose. Not trying to sway you. But the links were added as an extra. I think the graphic was featurable before. It contains a huge amount of information and a thoughtful layout of it. And we tried to make it look clean with the lines and all. It's better than similar published diagrams in the line organization. I think of it as providing a lot of function and reference for text that would be "hard" without a graphic to refer to. Kind of different from a pretty picture illustration. But no biggie. I want to try things that are new to help Wiki (haven't seen anything like this in other industry or chemicals articles.TCO (Reviews needed) 19:11, 10 January 2012 (UTC)
- Belated Oppose Missed the "deadline", but I thought I'd chime in anyway. I partly agree with Matthewedwards. This diagram isn't really our best work. It's pretty bare bones, not at all compelling, and frankly, it's not even particularly clear. It doesn't add much value to the article. There's an unexplained dashed line, and the arrows as a whole aren't really explained. Finally, this just doesn't compare to our current FP diagrams. Makeemlighter (talk) 15:51, 11 January 2012 (UTC)
- I appreciate what has been said about about the image not being compelling and is basic but it isn't designed to be pretty, that's what Commons FP is for, should be based on it's EV. Fallschirmjäger ✉ 21:02, 11 January 2012 (UTC)
- What's presented in the image is pure text. From a quick read of the article where the image is placed, it doesn't appear that it's really discussed in depth. From a WP:ACCESS perspective, for anyone who is blind or has images turned off this is a real problem because the encyclopedic information isn't available in any other form. It's not like this is a picture of a bird or a building or a piece of fruit where an ACCESS reader can "get by" without it, because the articles about those things should discuss their appearance. Matthewedwards : Chat 21:18, 12 January 2012 (UTC)
- (Still not trying to change your vote). Whole Industry section (and three subsections) is an arrangement of about 15 paragraphs expanding on each box and in a logical order. The amounts are shown, the conversion paths are shown. The relative importance (highes percent higher in drawing) is shown. Yeah...it doesn't have bells or whistles, but emphasis is on structure and on researched content. I did like the upgrades the reviewers made us do (notes, links, some nits, etc.)TCO (Reviews needed) 02:54, 13 January 2012 (UTC)
- On the dashed line, would you prefer a little arc to show it jumping over the other line?TCO (Reviews needed) 16:04, 11 January 2012 (UTC)
- Not sure of the best way to display it. Maybe just note it on the diagram. Makeemlighter (talk) 17:17, 11 January 2012 (UTC)
- I will ask for a line break back (how it was originally). That or an arc "jumping" is the norm and pretty intuitive. The dashed line is non-standard in a process flow diagram. Words is way too clunky. See here for an example: (look to bottom right where the two liquids cross).
 TCO (Reviews needed) 18:09, 11 January 2012 (UTC)
- I will ask for a line break back (how it was originally). That or an arc "jumping" is the norm and pretty intuitive. The dashed line is non-standard in a process flow diagram. Words is way too clunky. See here for an example: (look to bottom right where the two liquids cross).
- Not sure of the best way to display it. Maybe just note it on the diagram. Makeemlighter (talk) 17:17, 11 January 2012 (UTC)

Promoted File:The fluorine economy.svg --Papa Lima Whiskey 2 (talk) 11:28, 13 January 2012 (UTC)
- 5 supports, one timely and one late oppose Papa Lima Whiskey 2 (talk) 11:28, 13 January 2012 (UTC)