
New York's 27th congressional district: Difference between revisions
update Tags: Mobile edit Mobile web edit |
Tags: Mobile edit Mobile web edit |
||
| Line 538: | Line 538: | ||
|- style="height:3em" |
|- style="height:3em" |
||
| align=left | [[File:Chris Jacobs 117th Congress. |
| align=left | [[File:Chris Jacobs 117th Congress portrait.jpg|100px]]<br/>'''[[Chris Jacobs (politician)|Chris Jacobs]]''' |
||
| {{Party shading/Republican}} | [[Republican Party (United States)|Republican]] |
| {{Party shading/Republican}} | [[Republican Party (United States)|Republican]] |
||
| nowrap | June 23, 2020 –<br>present<!--Service begins when elected & qualified, NOT when sworn--> |
| nowrap | June 23, 2020 –<br>present<!--Service begins when elected & qualified, NOT when sworn--> |
||
Revision as of 12:10, 28 September 2021
| New York's 27th congressional district | |
|---|---|
 New York's 27th congressional district since January 3, 2013 | |
| Representative | |
| Distribution |
|
| Population (2019) | 719,554 |
| Median household income | $69,186[1] |
| Ethnicity |
|
| Cook PVI | R+12[2] |
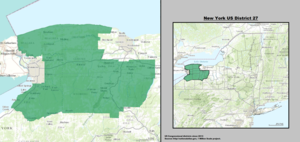
The 27th congressional district of New York is a congressional district for the United States House of Representatives in western New York. It includes all of Orleans, Genesee, Wyoming, and Livingston counties and parts of Erie, Monroe, Niagara, and Ontario counties. The district contains most of the eastern and southern suburbs of Buffalo, most of the southern suburbs of Rochester, as well as large rural areas to the east and south. The seat is currently occupied by Republican Chris Jacobs, who won a special election on June 23, 2020.[3][4] Previously, it had been vacant since October 1, 2019, when Republican incumbent Chris Collins resigned after pleading guilty to charges of insider trading.[5] It is considered the most Republican-leaning district in the state, with Donald Trump having won it by 24.5 points in 2016. It is also one of the most conservative districts in the Northeastern United States, leaning more Republican than any district in New England or New Jersey. Following the reapportionment process after the 2020 census, New York garnered national attention for falling just 89 people short of retaining its 27th congressional district. The 435th seat instead went to Minnesota. The district will be eliminated in the 2022 midterm elections.
Historical location
The precursor to the district was the central Erie county seat numbered the 30th district in the 1990s. In the 1980s this area was in the 33rd district. In the 1970s it was numbered the 37th district, although certain suburban areas were in the 38th district (later the 31st). None of these districts included the Jamestown area, which had always been in the southern tier district (now the 29th district) in prior maps.
The 27th district covered the area now in the 26th district in the 1990s and the Syracuse area (now the 25th district) in the 1980s. It was the Southern Tier seat now numbered the 22nd in the 1970s. In the 1960s this district was in the lower Hudson Valley covering the area now in the 19th district.
Future
The district will become obsolete following the 2020 United States census.[6]
Recent election results in statewide races
| Year | Office | Results |
|---|---|---|
| 1992 | President | Bush 42–33% |
| 1996 | President | Clinton 43–43% |
| 2000 | President | Gore 53–41% |
| 2004 | President | Kerry 53–45% |
| 2008 | President | McCain 54–44% |
| 2012 | President | Romney 55–42% |
| 2016 | President | Trump 59–35% |
| 2020 | President | Trump 56–41% |
List of members representing the district


.jpg)


.jpg)


Election results
In New York State electoral politics there are numerous minor parties at various points on the political spectrum. Certain parties will invariably endorse either the Republican or Democratic candidate for every office, hence the state electoral results contain both the party votes, and the final candidate votes (listed as "Recap").
| Party | Candidate | Votes | % | ±% | |
|---|---|---|---|---|---|
| Republican | Bill Paxon (incumbent) | 142,568 | 59.9% | ||
| Democratic | Thomas M. Fricano | 95,503 | 40.1% | ||
| Majority | 47,065 | 19.8% | |||
| Turnout | 238,071 | 100% | |||
| Party | Candidate | Votes | % | ±% | |
|---|---|---|---|---|---|
| Republican | Thomas M. Reynolds | 102,042 | 57.3% | −2.6% | |
| Democratic | Bill Cook | 75,978 | 42.7% | +2.6% | |
| Majority | 26,064 | 14.6% | −5.2% | ||
| Turnout | 178,020 | 100% | −25.2% | ||
| Party | Candidate | Votes | % | ±% | |
|---|---|---|---|---|---|
| Republican | Thomas M. Reynolds (incumbent) | 157,694 | 69.3% | +12.0% | |
| Democratic | Thomas W. Pecoraro | 69,870 | 30.7% | −12.0% | |
| Majority | 87,824 | 38.6% | +24.0% | ||
| Turnout | 227,564 | 100% | +27.8% | ||
| Party | Candidate | Votes | % | ±% | |
|---|---|---|---|---|---|
| Republican | Jack Quinn | 120,117 | 69.1% | −0.2% | |
| Democratic | Peter Crotty | 47,811 | 27.5% | −3.2% | |
| Right to Life | Thomas Casey | 3,586 | 2.1% | +2.1% | |
| Green | Albert N. LaBruna | 2,405 | 1.4% | +1.4% | |
| Majority | 72,306 | 41.6% | +3.0% | ||
| Turnout | 173,919 | 100% | −23.6% | ||
| Party | Candidate | Votes | % | ±% | |
|---|---|---|---|---|---|
| Democratic | Brian Higgins | 143,332 | 50.7% | +23.2% | |
| Republican | Nancy A. Naples | 139,558 | 49.3% | −19.8% | |
| Majority | 3,774 | 1.3% | −40.3% | ||
| Turnout | 282,890 | 100% | +62.7% | ||
| Party | Candidate | Votes | % | ±% | |
|---|---|---|---|---|---|
| Democratic | Brian Higgins (incumbent) | 140,027 | 79.3% | +28.6% | |
| Republican | Michael J. McHale | 36,614 | 20.7% | −28.6% | |
| Majority | 103,413 | 58.5% | +57.2% | ||
| Turnout | 176,641 | 100% | −37.6% | ||
| Party | Candidate | Votes | % | ±% | |
|---|---|---|---|---|---|
| Democratic | Brian Higgins (incumbent) | 185,713 | 74.4% | −4.9% | |
| Republican | Daniel J. Humiston | 56,354 | 22.6% | +1.9% | |
| Conservative | Harold W. Schroeder | 7,478 | 3% | +3% | |
| Majority | 129,359 | 51.8% | −6.7% | ||
| Turnout | 249,545 | 100% | +41.3% | ||
| Party | Candidate | Votes | % | ±% | |
|---|---|---|---|---|---|
| Democratic | Brian Higgins (incumbent) | 119,085 | 60.9% | −13.5% | |
| Republican | Leonard A. Roberto | 76,320 | 39.1% | +16.5% | |
| Majority | 42,765 | 21.9% | 29.9% | ||
| Turnout | 195,405 | 100% | −21.7% | ||
| Party | Candidate | Votes | % | ±% | |
|---|---|---|---|---|---|
| Republican | Chris Collins | 161,220 | 50.8% | +11.7% | |
| Democratic | Kathy Hochul | 156,219 | 49.2% | −11.7% | |
| Majority | 5,001 | 1.6% | −20.3% | ||
| Turnout | 317,439 | 100% | +62.4% | ||
| Party | Candidate | Votes | % | ±% | |
|---|---|---|---|---|---|
| Republican | Chris Collins (incumbent) | 144,675 | 71.1% | +20.3% | |
| Democratic | Jim O'Donnell | 58,911 | 28.9% | −20.3% | |
| Majority | 85,764 | 42.2% | +40.6% | ||
| Turnout | 203,586 | 100% | −35.9% | ||
| Party | Candidate | Votes | % | ±% | |
|---|---|---|---|---|---|
| Republican | Chris Collins (incumbent) | 220,885 | 67.2% | −3.9% | |
| Democratic | Diana Kastenbaum | 107,832 | 32.8% | +3.9% | |
| Majority | 113,053 | 34.4% | −7.8% | ||
| Turnout | 328,717 | 100% | +61.4% | ||
| Party | Candidate | Votes | % | ±% | |
|---|---|---|---|---|---|
| Republican | Chris Collins (incumbent) | 140,146 | 49.1% | −18.1% | |
| Democratic | Nate McMurray | 139,059 | 48.8% | +16% | |
| Reform | Larry Piegza | 5,973 | 2.1% | +2.1% | |
| Majority | 1,087 | 0.3% | −34.1% | ||
| Turnout | 285,178 | 100% | −13.2% | ||
| Party | Candidate | Votes | % | ±% | |
|---|---|---|---|---|---|
| Republican | Chris Jacobs | 81,036 | 51.8% | +2.7% | |
| Democratic | Nathan McMurray | 72,787 | 46.5% | −2.3% | |
| Libertarian | Duane Whitmer | 1,498 | 1.0% | +1.0% | |
| Green | Michael Gammariello | 1,043 | 0.7% | +0.7% | |
| Plurality | 8,249 | 5.05% | +4.75% | ||
| Turnout | 156,364 | ||||
| Party | Candidate | Votes | % | |
|---|---|---|---|---|
| Republican | Chris Jacobs | 192,756 | 50.2 | |
| Conservative | Chris Jacobs | 31,027 | 8.1 | |
| Independence | Chris Jacobs | 5,261 | 1.4 | |
| Total | Chris Jacobs (incumbent) | 229,044 | 59.7 | |
| Democratic | Nate McMurray | 136,783 | 35.7 | |
| Working Families | Nate McMurray | 12,776 | 3.3 | |
| Total | Nate McMurray | 149,559 | 39.0 | |
| Libertarian | Duane Whitmer | 4,884 | 1.3 | |
| Total votes | 383,487 | 100.0 | ||
| Republican hold | ||||
See also
- List of United States congressional districts
- New York's congressional districts
- United States congressional delegations from New York
References
- ^ Center for New Media & Promotion (CNMP), US Census Bureau. "My Congressional District". www.census.gov.
- ^ "Introducing the 2021 Cook Political Report Partisan Voter Index". The Cook Political Report. April 15, 2021. Retrieved April 15, 2021.
- ^ McKinley, Jesse (June 24, 2020). "Republicans Retain House Seat in Special Election in Western N.Y." The New York Times. ISSN 0362-4331. Retrieved June 27, 2020.
- ^ "NY Republican Chris Jacobs sworn in as newest House member". AP NEWS. July 21, 2020. Retrieved July 22, 2020.
- ^ Orden, Erica (September 30, 2019). "Rep. Chris Collins to resign amid plans to plead guilty in insider trading case". CNN.
- ^ Merica, Dan; Stark, Liz (April 26, 2021). "Census Bureau announces 331 million people in US, Texas will add two congressional seats". CNN. Retrieved April 26, 2021.
- ^ "New York Special Election Results: 27th Congressional District". The New York Times. ISSN 0362-4331. Retrieved July 19, 2020.
- ^ "2020 Election Results". New York State Board of Elections. Retrieved December 3, 2020.
- Martis, Kenneth C. (1989). The Historical Atlas of Political Parties in the United States Congress. New York: Macmillan Publishing Company.
- Martis, Kenneth C. (1982). The Historical Atlas of United States Congressional Districts. New York: Macmillan Publishing Company.
- "Biographical Directory of the U.S. Congress - Retro Search". bioguideretro.congress.gov. Retrieved May 11, 2020.
- 2004 House election data, Clerk of the United States House of Representatives
- 2002 House election data, Clerk of the United States House of Representatives
- 2000 House election data, Clerk of the United States House of Representatives
- 1998 House election data, Clerk of the United States House of Representatives
- 1996 House election data, Clerk of the United States House of Representatives