
Hartland, Connecticut
Hartland, Connecticut | |
|---|---|
 Seal | |
 Location in Hartford County, Connecticut. | |
| Coordinates: 42°00′18″N 72°56′53″W / 42.00500°N 72.94806°W | |
| Country | |
| U.S. state | |
| County | Hartford |
| Metropolitan area | Hartford |
| Incorporated | 1761 |
| Villages | Hartland East Hartland West Hartland |
| Government | |
| • Type | Selectman-town meeting |
| • First selectman | Wade E. Cole (D) |
| • Selectman | Magi Winslow (D) |
| • Selectman | Scott M. Levan (R) |
| Area | |
| • Total | 34.6 sq mi (89.6 km2) |
| • Land | 33.1 sq mi (85.7 km2) |
| • Water | 1.5 sq mi (3.9 km2) |
| Elevation | 531 ft (162 m) |
| Population (2010) | |
| • Total | 2,114 |
| • Density | 61/sq mi (24/km2) |
| Time zone | UTC-5 (Eastern) |
| • Summer (DST) | UTC-4 (Eastern) |
| ZIP code | 06027 |
| FIPS code | 09-37140 |
| GNIS feature ID | 0213443 |
| Website | www |
Hartland is a town in Hartford County, Connecticut, United States. The population was 2,114 at the 2010 census.[1]
Geography
According to the United States Census Bureau, the town has a total area of 34.6 square miles (89.6 km2), of which 33.1 square miles (85.7 km2) is land and 1.5 square miles (3.9 km2), or 4.39%, is water.[1] Bounded on the north by the Massachusetts border, Hartland is drained by the Farmington River, a tributary of the Connecticut River. The 42nd parallel north and the 73rd meridian west meet in the central western part of town.
Demographics

| Census | Pop. | Note | %± |
|---|---|---|---|
| 1800 | 1,318 | — | |
| 1810 | 1,284 | −2.6% | |
| 1820 | 1,254 | −2.3% | |
| 1830 | 1,221 | −2.6% | |
| 1840 | 1,060 | −13.2% | |
| 1850 | 848 | −20.0% | |
| 1860 | 846 | −0.2% | |
| 1870 | 789 | −6.7% | |
| 1880 | 643 | −18.5% | |
| 1890 | 565 | −12.1% | |
| 1900 | 592 | 4.8% | |
| 1910 | 544 | −8.1% | |
| 1920 | 448 | −17.6% | |
| 1930 | 296 | −33.9% | |
| 1940 | 300 | 1.4% | |
| 1950 | 549 | 83.0% | |
| 1960 | 1,040 | 89.4% | |
| 1970 | 1,303 | 25.3% | |
| 1980 | 1,416 | 8.7% | |
| 1990 | 1,866 | 31.8% | |
| 2000 | 2,012 | 7.8% | |
| 2010 | 2,114 | 5.1% | |
| 2014 (est.) | 2,129 | [2] | 0.7% |
| U.S. Decennial Census[3] | |||
As of the census[4] of 2000, there were 2,012 people, 707 households, and 583 families residing in the town. The population density was 60.9 people per square mile (23.5/km²). There were 759 housing units at an average density of 23.0 per square mile (8.9/km²). The racial makeup of the town was 98.31% White, 0.15% African American, 0.05% Native American, 0.60% Asian, 0.05% Pacific Islander, 0.20% from other races, and 0.65% from two or more races. Hispanic or Latino of any race were 0.60% of the population.
There were 707 households out of which 38.9% had children under the age of 18 living with them, 70.9% were married couples living together, 8.5% had a female householder with no husband present, and 17.5% were non-families. 13.4% of all households were made up of individuals and 5.2% had someone living alone who was 65 years of age or older. The average household size was 2.83 and the average family size was 3.12.
In the town, the population was spread out with 27.3% under the age of 18, 5.1% from 18 to 24, 29.4% from 25 to 44, 27.5% from 45 to 64, and 10.6% who were 65 years of age or older. The median age was 40 years. For every 100 females, there were 100.0 males. For every 100 females age 18 and over, there were 102.2 males.
The median income for a household in the town was $64,674, and the median income for a family was $66,164. Males had a median income of $48,309 versus $31,321 for females. The per capita income for the town was $26,473. About 1.7% of families and 2.1% of the population were below the poverty line, including 0.6% of those under age 18 and 0.9% of those age 65 or over.
Government and politics
#E81B23 #3333FF #DDDDBB #FED105| Voter Registration and Party Enrollment as of October 25, 2005[5] | |||||
|---|---|---|---|---|---|
| Party | Active Voters | Inactive Voters | Total Voters | Percentage | |
| Republican | 615 | 6 | 621 | 41.46% | |
| Democratic | 337 | 5 | 342 | 22.83% | |
| Unaffiliated | 523 | 9 | 532 | 35.51% | |
| Minor Parties | 3 | 0 | 3 | 0.20% | |
| Total | 1,478 | 20 | 1,498 | 100% | |
| Year | Democratic | Republican | Third Parties |
|---|---|---|---|
| 2016 | 28.19% 349 | 64.94% 804 | 6.87% 85 |
| 2012 | 34.36% 414 | 64.56% 778 | 1.08% 13 |
| 2008 | 38.87% 496 | 59.25% 756 | 1.88% 24 |
| 2004 | 37.15% 435 | 60.46% 708 | 2.39% 28 |
| 2000 | 36.60% 388 | 54.81% 581 | 8.59% 91 |
| 1996 | 32.31% 317 | 50.56% 496 | 17.13% 168 |
| 1992 | 28.42% 303 | 42.96% 458 | 28.61% 305* |
| 1988 | 35.25% 318 | 63.97% 577 | 0.78% 7 |
| 1984 | 22.97% 181 | 76.40% 602 | 0.63% 5 |
| 1980 | 25.83% 178 | 57.62% 397 | 16.55% 114 |
| 1976 | 33.12% 206 | 66.24% 412 | 0.64% 4 |
| 1972 | 21.31% 130 | 77.71% 474 | 0.98% 6 |
| 1968 | 26.12% 146 | 67.26% 376 | 6.62% 37 |
| 1964 | 43.01% 203 | 56.99% 269 | 0.00% 0 |
| 1960 | 21.03% 98 | 78.70% 362 | 0.00% 0 |
| 1956 | 13.23% 52 | 86.77% 341 | 0.00% 0 |
- 1992: Third-party/Independent candidate Ross Perot received 304 votes (28.52%), one more vote than Democrat Bill Clinton, to finish second.
Site of interest
Notable residents
- Asher Benjamin, architect
- Gary Burghoff, actor
- Uriel Holmes, congressman
- Consider Tiffany, British loyalist
- John Trumbull, artist
References
- ^ a b "Geographic Identifiers: 2010 Demographic Profile Data (G001): Hartland town, Hartford County, Connecticut". U.S. Census Bureau, American Factfinder. Retrieved November 28, 2012.
- ^ "Annual Estimates of the Resident Population for Incorporated Places: April 1, 2010 to July 1, 2014". Retrieved June 4, 2015.
- ^ "Census of Population and Housing". Census.gov. Retrieved June 4, 2015.
- ^ "American FactFinder". United States Census Bureau. Retrieved 2008-01-31.
- ^ "Registration and Party Enrollment Statistics as of October 25, 2005" (PDF). Connecticut Secretary of State. Archived from the original (PDF) on 2006-09-23. Retrieved 2006-10-02.
- ^ https://authoring.ct.gov//SOTS/Election-Services/Statement-Of-Vote-PDFs/General-Elections-Statement-of-Vote-1922
Further reading
External links
Municipalities and communities of Hartford County, Connecticut, United States | ||
|---|---|---|
| Cities | 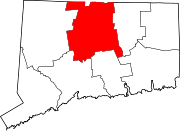 | |
| Towns | ||
| CDPs | ||
| Other communities | ||