
2022 Sutton London Borough Council election
| ||||||||||||||||||||||||||||||||||||||||||||||||||||||||||||||||||||
All 55 council seats | ||||||||||||||||||||||||||||||||||||||||||||||||||||||||||||||||||||
|---|---|---|---|---|---|---|---|---|---|---|---|---|---|---|---|---|---|---|---|---|---|---|---|---|---|---|---|---|---|---|---|---|---|---|---|---|---|---|---|---|---|---|---|---|---|---|---|---|---|---|---|---|---|---|---|---|---|---|---|---|---|---|---|---|---|---|---|---|
| ||||||||||||||||||||||||||||||||||||||||||||||||||||||||||||||||||||
| ||||||||||||||||||||||||||||||||||||||||||||||||||||||||||||||||||||
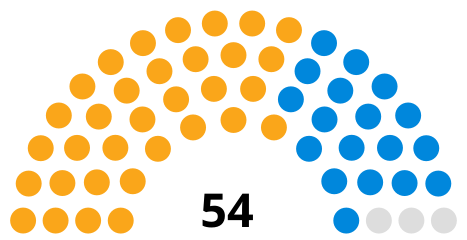
The 2022 Sutton London Borough Council election took place on 5 May 2022. All 55 members of Sutton London Borough Council were elected. The elections took place alongside local elections in the other London boroughs and elections to local authorities across the United Kingdom.
In the previous election in 2018, the Liberal Democrats maintained their longstanding control of the council, winning 33 out of the 54 seats with the Conservative Party forming the principal opposition with eighteen of the remaining 21 seats. The 2022 election took place under new election boundaries, which increased the number of councillors to 55.
Background[edit]
History[edit]

The thirty-two London boroughs were established in 1965 by the London Government Act 1963. They are the principal authorities in Greater London and have responsibilities including education, housing, planning, highways, social services, libraries, recreation, waste, environmental health and revenue collection. Some of the powers are shared with the Greater London Authority, which also manages passenger transport, police and fire.[1]
After its formation, Sutton was under Conservative control until 1986. After a brief period of no overall control, the Liberal Democrats gained a majority on the council and have maintained overall control since. In the most recent council election in 2018, the Liberal Democrats won 33 seats with 38.8% of the vote while the Conservatives won 18 seats with 36.3% of the vote across the borough. The remaining three seats were won by independent candidates.[2] One of the independents was a former Liberal Democrat opposed to plans to build an incinerator.[3]
Council term[edit]
A Conservative councillor for Belmont ward, Patrick McManus, resigned in September 2018.[4] The by-election in October 2018 was held for the Conservatives by Neil Garratt, a former councillor and deputy leader of the Conservative group who had lost his seat in the May 2018 council election. The Liberal Democrats came second, reducing the Conservative majority compared to May.[5] Joyce Melican, a Liberal Democrat councillor for Wallington North, resigned in February 2019 for health reasons. She had served as a councillor since 2010.[6] The Liberal Democrat candidate Barry Lewis won the seat in the 29 March 2019 by-election with a reduced majority against the Conservatives.[7]
As with most London boroughs, Sutton were electing its councillors under new boundaries decided by the Local Government Boundary Commission for England, which it produced after a period of consultation. The number of councillors rose from 54 to 55 and the commission produced new boundaries following a period of consultation, with fifteen three-member wards and five two-member wards.[8]
Electoral process[edit]
Sutton, like other London borough councils, elects all of its councillors at once every four years. The previous election took place in 2018. The 2022 election took place by multi-member first-past-the-post voting, with each ward being represented by two or three councillors. Electors had as many votes as there are councillors to be elected in their ward, with the top two or three being elected.
All registered electors (British, Irish, Commonwealth and European Union citizens) living in London aged 18 or over were entitled to vote in the election. People who live at two addresses in different councils, such as university students with different term-time and holiday addresses, were entitled to be registered for and vote in elections in both local authorities.[9] Voting in-person at polling stations will take place from 7:00 to 22:00 on election day, and voters were able to apply for postal votes or proxy votes in advance of the election.[9]
Council composition[edit]
-
 Council composition after the 2018 election
 -
Council composition ahead of the 2022 election

| After 2018 election | Before 2022 election | After 2022 election[10] | ||||||
|---|---|---|---|---|---|---|---|---|
| Party | Seats | Party | Seats | Party | Seats | |||
| Liberal Democrats | 33 | Liberal Democrats | 33 | Liberal Democrats | 29 | |||
| Conservative | 18 | Conservative | 18 | Conservative | 20 | |||
| Independent | 3 | Independent | 3 | Independent | 3 | |||
| Labour | 0 | Labour | 0 | Labour | 3 | |||
Results summary[edit]
| Party | Seats | Gains | Losses | Net gain/loss | Seats % | Votes % | Votes | +/− | |
|---|---|---|---|---|---|---|---|---|---|
| Liberal Democrats | 29 | 2 | 1 | 52.7 | 39.6 | 65,942 | +0.8 | ||
| Conservative | 20 | 1 | 2 | 36.4 | 36.2 | 60,217 | -0.1 | ||
| Labour | 3 | 0 | 0 | 5.5 | 16.9 | 28,170 | -0.9 | ||
| Independent | 3 | 0 | 0 | 5.5 | 3.6 | 6,069 | +1.3 | ||
| Green | 0 | 0 | 0 | 0.0 | 3.6 | 5,984 | +1.1 | ||
| CPA | 0 | 0 | 0 | 0.0 | 0.1 | 132 | +0.1 | ||
| SDP | 0 | 0 | 0 | 0.0 | 0.0 | 33 | New | ||
Ward Results[edit]
Beddington[edit]
| Party | Candidate | Votes | % | ±% | |
|---|---|---|---|---|---|
| Independent | Nicholas Mattey* | 1,231 | 39.7 | ||
| Independent | Tim Foster* | 1,162 | 37.5 | ||
| Independent | Jillian Green* | 1,150 | 37.1 | ||
| Liberal Democrats | Kuhan Nathan | 706 | 22.8 | ||
| Conservative | Heather Howell | 686 | 22.1 | ||
| Conservative | Julia Russell | 619 | 20.0 | ||
| Conservative | Alison Huneke | 608 | 19.6 | ||
| Liberal Democrats | Martin Thompson | 599 | 19.3 | ||
| Liberal Democrats | Thomas Badham | 598 | 19.3 | ||
| Labour | Margaret Hughes | 589 | 19.3 | ||
| Labour | John Keys | 516 | 16.6 | ||
| Labour | Patricia McCarthy | 488 | 15.7 | ||
| Green | Michael Boulton | 352 | 11.3 | ||
| Turnout | |||||
| Independent win (new seat) | |||||
| Independent win (new seat) | |||||
| Independent win (new seat) | |||||
Belmont[edit]
| Party | Candidate | Votes | % | ±% | |
|---|---|---|---|---|---|
| Conservative | David Hicks* | 1,537 | 46.5 | ||
| Conservative | Neil Garratt* | 1,531 | 46.3 | ||
| Conservative | Jane Pascoe* | 1,414 | 42.8 | ||
| Liberal Democrats | Samantha Bourne | 1,244 | 37.6 | ||
| Liberal Democrats | Dean Juster | 1,182 | 35.7 | ||
| Liberal Democrats | Samuel Weatherlake* | 1,005 | 30.4 | ||
| Labour | Gale Blears | 586 | 17.7 | ||
| Labour | Alan Aylward | 535 | 16.2 | ||
| Labour | Marian Wingrove | 474 | 14.3 | ||
| Green | Duncan Lambe | 411 | 12.4 | ||
| Turnout | |||||
| Conservative hold | |||||
| Conservative hold | |||||
| Conservative hold | |||||
Carshalton Central[edit]
| Party | Candidate | Votes | % | ±% | |
|---|---|---|---|---|---|
| Liberal Democrats | Isabel Carvalho Araujo | 2,031 | 52.4 | ||
| Liberal Democrats | Jake Short* | 1,906 | 49.1 | ||
| Liberal Democrats | Andrew Jenner | 1,688 | 43.5 | ||
| Green | Verity Thomson | 1,294 | 33.4 | ||
| Conservative | Melissa Pearce | 1,141 | 29.4 | ||
| Conservative | Ethan Smith | 1,088 | 28.0 | ||
| Conservative | Gillian Sparks | 1,083 | 27.9 | ||
| Labour | Marilynne Burbage | 491 | 12.7 | ||
| Labour | Anthony Thorpe | 474 | 12.2 | ||
| Labour | Peter Turner | 310 | 8.0 | ||
| CPA | Ashley Dickenson | 132 | 3.4 | ||
| Turnout | |||||
| Liberal Democrats hold | |||||
| Liberal Democrats hold | |||||
| Liberal Democrats hold | |||||
Carshalton South & Clockhouse[edit]
| Party | Candidate | Votes | % | ±% | |
|---|---|---|---|---|---|
| Conservative | Moira Butt* | 1,698 | 47.8 | ||
| Conservative | Timothy Crowley* | 1,669 | 47.0 | ||
| Liberal Democrats | Amy Haldane* | 1,617 | 45.6 | ||
| Conservative | Lynne Fletcher | 1,544 | 43.5 | ||
| Liberal Democrats | Brendan Hudson | 1,523 | 42.9 | ||
| Liberal Democrats | Noormahamod Sumun | 1,317 | 37.1 | ||
| Green | Hannah Smith | 387 | 10.9 | ||
| Labour | John Clay | 329 | 9.3 | ||
| Labour | Michael McLoughlin | 286 | 8.1 | ||
| Labour | Roberta Lambert | 279 | 7.9 | ||
| Turnout | |||||
| Conservative hold | |||||
| Conservative hold | |||||
| Liberal Democrats hold | |||||
Cheam[edit]
| Party | Candidate | Votes | % | ±% | |
|---|---|---|---|---|---|
| Conservative | Eric Allen* | 1,747 | 51.7 | ||
| Conservative | Tony Shields | 1,680 | 49.7 | ||
| Conservative | Vanessa Udall | 1,635 | 48.4 | ||
| Liberal Democrats | Alex Chui | 1,213 | 35.9 | ||
| Liberal Democrats | Ben Devlin | 1,168 | 34.6 | ||
| Liberal Democrats | Harry Legge | 1,002 | 29.7 | ||
| Labour | Sarah McGuinness | 486 | 14.4 | ||
| Green | John Triggs | 466 | 13.8 | ||
| Labour | Simon Muir | 373 | 11.0 | ||
| Labour | George Richards | 364 | 10.8 | ||
| Turnout | |||||
| Conservative hold | |||||
| Conservative hold | |||||
| Conservative hold | |||||
Hackbridge[edit]
| Party | Candidate | Votes | % | ±% | |
|---|---|---|---|---|---|
| Labour | David Tchilingirian | 1,029 | 55.1 | ||
| Labour | Sheldon Vestey | 951 | 50.9 | ||
| Liberal Democrats | Joanna Sherman | 543 | 29.1 | ||
| Liberal Democrats | Alexander Vicente-Machado | 494 | 26.5 | ||
| Conservative | David Ruthven-Murray | 365 | 19.5 | ||
| Conservative | Emma Scully | 353 | 18.9 | ||
| Turnout | |||||
| Labour win (new seat) | |||||
| Labour win (new seat) | |||||
North Cheam[edit]
| Party | Candidate | Votes | % | ±% | |
|---|---|---|---|---|---|
| Conservative | Michael Dwyer | 1,640 | 47.7 | ||
| Conservative | James McDermott-Hill* | 1,628 | 47.4 | ||
| Conservative | Paramalingham Vivehanandha | 1,600 | 46.6 | ||
| Liberal Democrats | Laura Cooney | 1,237 | 36.0 | ||
| Liberal Democrats | Jason Stone | 1,167 | 34.0 | ||
| Liberal Democrats | Carl Nichols | 1,134 | 33.0 | ||
| Labour | Jane Davies | 549 | 16.0 | ||
| Labour | David Owen | 453 | 13.2 | ||
| Labour | Raymond Eveleigh | 446 | 13.0 | ||
| Green | Christopher Beard | 347 | 10.1 | ||
| Independent | Renos Costi | 105 | 3.1 | ||
| Turnout | |||||
| Conservative win (new seat) | |||||
| Conservative win (new seat) | |||||
| Conservative win (new seat) | |||||
South Beddington & Roundshaw[edit]
| Party | Candidate | Votes | % | ±% | |
|---|---|---|---|---|---|
| Conservative | Jonathan Pearce | 1,232 | 42.0 | ||
| Liberal Democrats | Edward Joyce* | 1,201 | 40.9 | ||
| Conservative | Patrick Magnus | 1,188 | 40.5 | ||
| Conservative | Ryan Stoneman* | 1,183 | 40.3 | ||
| Liberal Democrats | Drew Heffernan* | 1,166 | 39.8 | ||
| Liberal Democrats | Srividhya Koteeswaran | 1,101 | 37.5 | ||
| Labour | Jacqueline McLoughlin | 434 | 14.8 | ||
| Labour | David Towler | 377 | 12.9 | ||
| Labour | Kiran Nawaz | 372 | 12.7 | ||
| Green | Helene McDonagh | 192 | 6.5 | ||
| Independent | Hannah Hamilton | 147 | 5.0 | ||
| Independent | Katie Bickel | 103 | 3.5 | ||
| Independent | Joseph Prowse | 70 | 2.4 | ||
| SDP | Steven Kelleher | 33 | 1.1 | ||
| Turnout | |||||
| Conservative win (new seat) | |||||
| Liberal Democrats win (new seat) | |||||
| Conservative win (new seat) | |||||
St Helier East[edit]
| Party | Candidate | Votes | % | ±% | |
|---|---|---|---|---|---|
| Liberal Democrats | Paul Cole | 643 | 41.6 | ||
| Liberal Democrats | Gemma Munday | 631 | 40.8 | ||
| Labour | Sarah Gwynn | 499 | 32.3 | ||
| Labour | Grace Platt | 439 | 28.4 | ||
| Conservative | Matthew Drew | 386 | 25.0 | ||
| Conservative | Ann Page | 370 | 24.0 | ||
| Green | Nicola Williams | 121 | 7.8 | ||
| Turnout | |||||
| Liberal Democrats win (new seat) | |||||
| Liberal Democrats win (new seat) | |||||
St Helier West[edit]
| Party | Candidate | Votes | % | ±% | |
|---|---|---|---|---|---|
| Labour | Sheila Berry | 848 | 35.5 | ||
| Conservative | Steven Alvarez | 823 | 34.5 | ||
| Conservative | Wendy Clark | 808 | 33.8 | ||
| Labour | Nicholas Diamantis | 780 | 32.7 | ||
| Labour | Paul McCarthy | 776 | 32.5 | ||
| Conservative | Ethan Windsor | 751 | 31.5 | ||
| Liberal Democrats | Omavally Narayana Pillay | 729 | 30.5 | ||
| Liberal Democrats | Peter Chubb | 703 | 29.4 | ||
| Liberal Democrats | Jean Crossby* | 702 | 29.4 | ||
| Green | Peter Mead | 243 | 10.2 | ||
| Turnout | |||||
| Labour win (new seat) | |||||
| Conservative win (new seat) | |||||
| Conservative win (new seat) | |||||
Stonecot[edit]
| Party | Candidate | Votes | % | ±% | |
|---|---|---|---|---|---|
| Liberal Democrats | Robert Beck | 996 | 44.7 | ||
| Liberal Democrats | Muttucumaru Sahathevan | 936 | 42.0 | ||
| Conservative | Paul Campbell | 852 | 38.2 | ||
| Conservative | William Townsend | 795 | 35.7 | ||
| Labour | Victoria Richer | 440 | 19.7 | ||
| Labour | Victoria Wright | 302 | 13.5 | ||
| Green | Karin Andrews Jashapara | 137 | 6.1 | ||
| Turnout | |||||
| Liberal Democrats gain from Conservative | |||||
| Liberal Democrats gain from Conservative | |||||
Sutton Central[edit]
| Party | Candidate | Votes | % | ±% | |
|---|---|---|---|---|---|
| Liberal Democrats | David Bartolucci* | 1,228 | 44.7 | ||
| Liberal Democrats | Edward Parsley | 1,102 | 40.1 | ||
| Liberal Democrats | Cryss Mennaceur | 1,038 | 37.8 | ||
| Labour | John McGeachy | 858 | 31.2 | ||
| Labour | Kerrie Peak | 834 | 30.3 | ||
| Labour | Natalie Wright | 816 | 29.7 | ||
| Conservative | Barry Russell | 722 | 26.3 | ||
| Conservative | Terence Woods | 657 | 23.9 | ||
| Conservative | Venu Sood | 643 | 23.4 | ||
| Green | Peter Friel | 351 | 12.8 | ||
| Turnout | |||||
| Liberal Democrats hold | |||||
| Liberal Democrats hold | |||||
| Liberal Democrats hold | |||||
Sutton North[edit]
| Party | Candidate | Votes | % | ±% | |
|---|---|---|---|---|---|
| Liberal Democrats | Ruth Dombey* | 1,343 | 41.5 | ||
| Liberal Democrats | Sam Cumber | 1,342 | 41.5 | ||
| Conservative | Bryony Lindsay-Charlton | 1,308 | 40.4 | ||
| Conservative | Aamir Haroon | 1,263 | 39.0 | ||
| Conservative | Ramachandran Mathanmohan | 1,241 | 38.4 | ||
| Liberal Democrats | Christopher Hawton | 1,189 | 36.8 | ||
| Labour | Gregory Charles | 590 | 18.2 | ||
| Labour | Teresa O'Brien | 538 | 16.6 | ||
| Labour | Lyndon Edwards | 509 | 15.7 | ||
| Green | Phoebe Connell | 380 | 11.7 | ||
| Turnout | |||||
| Liberal Democrats hold | |||||
| Liberal Democrats hold | |||||
| Conservative gain from Liberal Democrats | |||||
Sutton South[edit]
| Party | Candidate | Votes | % | ±% | |
|---|---|---|---|---|---|
| Liberal Democrats | Richard Clifton* | 1,718 | 49.4 | ||
| Liberal Democrats | Patricia Fivey* | 1,691 | 48.6 | ||
| Liberal Democrats | Louise Phelan | 1,521 | 43.7 | ||
| Conservative | Chandra Alapati | 1,434 | 41.2 | ||
| Conservative | Victoria Shields | 1,302 | 37.4 | ||
| Conservative | Arif Syed | 1,179 | 33.9 | ||
| Labour | Tessa Cornell | 579 | 16.6 | ||
| Labour | Stephen Blears | 550 | 15.8 | ||
| Labour | Graham Terrell | 461 | 13.3 | ||
| Turnout | |||||
| Liberal Democrats hold | |||||
| Liberal Democrats hold | |||||
| Liberal Democrats gain from Conservative | |||||
Sutton West & East Cheam[edit]
| Party | Candidate | Votes | % | ±% | |
|---|---|---|---|---|---|
| Liberal Democrats | Luke Taylor | 1,572 | 47.2 | ||
| Liberal Democrats | Christopher Woolmer | 1,519 | 45.6 | ||
| Liberal Democrats | Qasim Esak | 1,505 | 45.2 | ||
| Conservative | Lily Bande* | 1,369 | 41.1 | ||
| Conservative | Catherine Gray* | 1,331 | 40.0 | ||
| Conservative | Mukesh Rao | 1,266 | 38.0 | ||
| Labour | Nicholas Carter | 552 | 16.6 | ||
| Labour | Chibweka Kavindele | 452 | 13.6 | ||
| Labour | Carlos Thibaut | 427 | 12.8 | ||
| Turnout | |||||
| Liberal Democrats win (new seat) | |||||
| Liberal Democrats win (new seat) | |||||
| Liberal Democrats win (new seat) | |||||
The Wrythe[edit]
| Party | Candidate | Votes | % | ±% | |
|---|---|---|---|---|---|
| Liberal Democrats | Bobby Dean | 1,492 | 47.9 | ||
| Liberal Democrats | Colin Stears* | 1,337 | 43.0 | ||
| Liberal Democrats | Patrick Ogbonna | 1,225 | 39.4 | ||
| Conservative | Edward Dwight* | 1,175 | 37.8 | ||
| Conservative | Robert Okpuru | 1,138 | 36.6 | ||
| Conservative | Daisy Pearce | 1,084 | 34.8 | ||
| Labour | David Grant | 534 | 17.2 | ||
| Labour | Margaret Thomas | 488 | 15.7 | ||
| Labour | Cecil Tate | 468 | 15.0 | ||
| Green | Faye Burnett | 394 | 12.7 | ||
| Turnout | |||||
| Liberal Democrats hold | |||||
| Liberal Democrats hold | |||||
| Liberal Democrats hold | |||||
Wallington North[edit]
| Party | Candidate | Votes | % | ±% | |
|---|---|---|---|---|---|
| Liberal Democrats | Sunita Gordon* | 1,502 | 45.3 | ||
| Liberal Democrats | Marian James* | 1,451 | 43.8 | ||
| Liberal Democrats | Barry Lewis* | 1,332 | 40.2 | ||
| Conservative | Joel Freeman | 785 | 23.7 | ||
| Conservative | Alexander Dabysing | 773 | 23.3 | ||
| Conservative | Christopher Wortley | 716 | 21.6 | ||
| Independent | Kingsley Hamilton | 592 | 17.9 | ||
| Independent | Pamela Marsh | 581 | 17.5 | ||
| Independent | Katie Travers | 560 | 16.9 | ||
| Labour | Mary Towler | 522 | 15.8 | ||
| Labour | Marcia Turner | 388 | 11.7 | ||
| Labour | Ahmad Wattoo | 375 | 11.3 | ||
| Green | Christopher Donnelly | 361 | 10.9 | ||
| Turnout | |||||
| Liberal Democrats hold | |||||
| Liberal Democrats hold | |||||
| Liberal Democrats hold | |||||
Wallington South[edit]
| Party | Candidate | Votes | % | ±% | |
|---|---|---|---|---|---|
| Liberal Democrats | Jayne McCoy* | 1,830 | 56.0 | ||
| Liberal Democrats | Samuel Martin | 1,728 | 52.9 | ||
| Liberal Democrats | Muhammad Sadiq* | 1,585 | 48.5 | ||
| Conservative | Malcolm Brown | 916 | 28.0 | ||
| Conservative | Martin Simms | 838 | 25.7 | ||
| Conservative | Hilary Wortley | 804 | 24.6 | ||
| Labour | Eliot Carroll | 584 | 17.9 | ||
| Labour | Kausar Kamran | 444 | 13.6 | ||
| Labour | Maximillian Whelton | 389 | 11.9 | ||
| Green | Maeve Tomlinson | 314 | 9.6 | ||
| Independent | Daryl Gardner | 188 | 5.8 | ||
| Independent | Geoffrey Stone | 97 | 3.0 | ||
| Independent | David Wightwick | 83 | 2.5 | ||
| Turnout | |||||
| Liberal Democrats hold | |||||
| Liberal Democrats hold | |||||
| Liberal Democrats hold | |||||
Worcester Park North[edit]
| Party | Candidate | Votes | % | ±% | |
|---|---|---|---|---|---|
| Conservative | Thomas Drummond* | 1,233 | 47.0 | ||
| Conservative | Joe Quick | 1,086 | 41.4 | ||
| Liberal Democrats | Jenny Batt* | 919 | 35.0 | ||
| Liberal Democrats | James Appleby | 877 | 33.4 | ||
| Labour | Elizabeth Martin | 515 | 19.6 | ||
| Labour | Mehdi Kabash | 380 | 14.5 | ||
| Green | Virginia Boyd | 234 | 8.9 | ||
| Turnout | |||||
| Conservative win (new seat) | |||||
| Conservative win (new seat) | |||||
Worcester Park South[edit]
| Party | Candidate | Votes | % | ±% | |
|---|---|---|---|---|---|
| Conservative | Martina Allen* | 1,191 | 51.4 | ||
| Conservative | Peter Geiringer* | 1,109 | 47.8 | ||
| Liberal Democrats | Lauren Fivey | 831 | 35.8 | ||
| Liberal Democrats | Barry Reed | 764 | 33.0 | ||
| Labour | John Flowers | 372 | 16.0 | ||
| Labour | Ann Morrison | 370 | 16.0 | ||
| Turnout | |||||
| Conservative win (new seat) | |||||
| Conservative win (new seat) | |||||
References[edit]
- ^ "The essential guide to London local government | London Councils". www.londoncouncils.gov.uk. Retrieved 10 October 2021.
- ^ "Sutton London Borough Council". BBC News. Retrieved 22 October 2021.
- ^ Sheppard, Owen (4 May 2018). "Liberal Democrats remain in control of Sutton council". www.standard.co.uk. Retrieved 22 October 2021.
- ^ "Belmont by-election to be held as councillor steps down". Your Local Guardian. Retrieved 22 October 2021.
- ^ Baston, Lewis (26 October 2018). "Sutton: Conservatives hold off Lib Dem challenge in Belmont by-election". OnLondon. Retrieved 22 October 2021.
- ^ "Wallington councillor forced to quit due to 'ill health'". This Is Local London. Retrieved 22 October 2021.
- ^ "Liberal Democrats win Wallington North by-election". Your Local Guardian. Retrieved 22 October 2021.
- ^ "LGBCE | Sutton | LGBCE Site". www.lgbce.org.uk. Retrieved 22 October 2021.
- ^ a b "How the elections work | London Councils". www.londoncouncils.gov.uk. Retrieved 14 September 2021.
- ^ "Sutton result". BBC News. Retrieved 10 May 2022.
- ^ "Beddington - Results". Sutton Borough Council. Retrieved 10 May 2022.
- ^ "Belmont - Results". Sutton Borough Council. Retrieved 10 May 2022.
- ^ "Carshalton Central - Results". Sutton Borough Council. Retrieved 10 May 2022.
- ^ "Carshalton South and Clockhouse - Results". Sutton Borough Council. Retrieved 10 May 2022.
- ^ "Cheam - Results". Sutton Borough Council. Retrieved 10 May 2022.
- ^ "Hackbridge - Results". Sutton Borough Council. Retrieved 10 May 2022.
- ^ "North Cheam - Results". Sutton Borough Council. Retrieved 10 May 2022.
- ^ "South Beddington and Roundshaw - Results". Sutton Borough Council. Retrieved 10 May 2022.
- ^ "St Helier East - Results". Sutton Borough Council. Retrieved 10 May 2022.
- ^ "St Helier West - Results". Sutton Borough Council. Retrieved 10 May 2022.
- ^ "Stonecot - Results". Sutton Borough Council. Retrieved 10 May 2022.
- ^ "Sutton Central - Results". Sutton Borough Council. Retrieved 10 May 2022.
- ^ "Sutton North - Results". Sutton Borough Council. Retrieved 11 May 2022.
- ^ "Sutton South - Results". Sutton Borough Council. Retrieved 11 May 2022.
- ^ "Sutton West and East Cheam - Results". Sutton Borough Council. Retrieved 11 May 2022.
- ^ "The Wrythe - Results". Sutton Borough Council. Retrieved 11 May 2022.
- ^ "Wallington North - Results". Sutton Borough Council. Retrieved 11 May 2022.
- ^ "Wallington South - Results". Sutton Borough Council. Retrieved 11 May 2022.
- ^ "Worcester Park North - Results". Sutton Borough Council. Retrieved 11 May 2022.
- ^ "Worcester Park South - Results". Sutton Borough Council. Retrieved 11 May 2022.