Box plot

In descriptive statistics, a box plot or boxplot is a method for graphically depicting groups of numerical data through their quartiles. Box plots may also have lines extending from the boxes (whiskers) indicating variability outside the upper and lower quartiles, hence the terms box-and-whisker plot and box-and-whisker diagram. Outliers may be plotted as individual points. Box plots are non-parametric: they display variation in samples of a statistical population without making any assumptions of the underlying statistical distribution (though Tukey's boxplot assumes symmetry for the whiskers and normality for their length). The spacings between the different parts of the box indicate the degree of dispersion (spread) and skewness in the data, and show outliers. In addition to the points themselves, they allow one to visually estimate various L-estimators, notably the interquartile range, midhinge, range, mid-range, and trimean. Box plots can be drawn either horizontally or vertically. Box plots received their name from the box in the middle, and from the plot that they are.
History
The range-bar was introduced by Mary Eleanor Spear in 1952[1] and again in 1969.[2] The box and whiskers plot was first introduced in 1970 by John Tukey, who later published on the subject in 1977.[3]
Elements
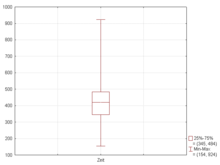
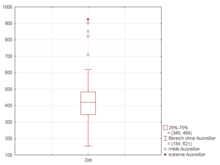
A boxplot is a standardized way of displaying the dataset based on a five-number summary: the minimum, the maximum, the sample median, and the first and third quartiles.
- Minimum (Q0 or 0th percentile): the lowest data point excluding any outliers.
- Maximum (Q4 or 100th percentile): the largest data point excluding any outliers.
- Median (Q2 or 50th percentile): the middle value of the dataset.
- First quartile (Q1 or 25th percentile): also known as the lower quartile qn(0.25), is the median of the lower half of the dataset.
- Third quartile (Q3 or 75th percentile): also known as the upper quartile qn(0.75), is the median of the upper half of the dataset.[4]
An important element used to construct the box plot by determining the minimum and maximum data values feasible, but is not part of the aforementioned five-number summary, is the interquartile range or IQR denoted below:
- Interquartile range (IQR) : is the distance between the upper and lower quartiles.
A boxplot is constructed of two parts, a box and a set of whiskers shown in Figure 2. The lowest point is the minimum of the data set and the highest point is the maximum of the data set. The box is drawn from Q1 to Q3 with a horizontal line drawn in the middle to denote the median.
The same data set can also be represented as a boxplot shown in Figure 3. From above the upper quartile, a distance of 1.5 times the IQR is measured out and a whisker is drawn up to the largest observed point from the dataset that falls within this distance. Similarly, a distance of 1.5 times the IQR is measured out below the lower quartile and a whisker is drawn up to the lower observed point from the dataset that falls within this distance. All other observed points are plotted as outliers.[5]
However, the whiskers can represent several alternative values, among them:
- the minimum and maximum of all of the data (as in figure 2)
- one standard deviation above and below the mean of the data
- the 9th percentile and the 91st percentile
- the 2nd percentile and the 98th percentile.
Any data not included between the whiskers should be plotted as an outlier with a dot, small circle, or star, but occasionally this is not done.
Some box plots include an additional character to represent the mean of the data.[6][7]
On some box plots a crosshatch is placed on each whisker, before the end of the whisker.
Rarely, box plots can be presented with no whiskers at all.
Because of this variability, it is appropriate to describe the convention being used for the whiskers and outliers in the caption for the plot.
The unusual percentiles 2%, 9%, 91%, 98% are sometimes used for whisker cross-hatches and whisker ends to show the seven-number summary. If the data are normally distributed, the locations of the seven marks on the box plot will be equally spaced.
Variations

Since the mathematician John W. Tukey popularized this type of visual data display in 1969, several variations on the traditional box plot have been described. Two of the most common are variable width box plots and notched box plots (see Figure 4).
Variable width box plots illustrate the size of each group whose data is being plotted by making the width of the box proportional to the size of the group. A popular convention is to make the box width proportional to the square root of the size of the group.[8]
Notched box plots apply a "notch" or narrowing of the box around the median. Notches are useful in offering a rough guide to significance of difference of medians; if the notches of two boxes do not overlap, this offers evidence of a statistically significant difference between the medians.[8] The width of the notches is proportional to the interquartile range (IQR) of the sample and inversely proportional to the square root of the size of the sample. However, there is uncertainty about the most appropriate multiplier (as this may vary depending on the similarity of the variances of the samples).[8] One convention is to use .[9]
Adjusted box plots are intended for skew distributions. They rely on the medcouple statistic of skewness.[10] For a medcouple value of MC, the lengths of the upper and lower whiskers are respectively defined to be
For symmetrical distributions, the medcouple will be zero, and this reduces to Tukey's boxplot with equal whisker lengths of for both whiskers.
Other kinds of plots such as violin plots and bean plots can show the difference between single-modal and multimodal distributions, a difference that cannot be seen with the original boxplot.[11]
Examples
Example without outliers

A series of hourly temperatures were measured throughout the day in degrees Fahrenheit. The recorded values are listed in order as follows: 57, 57, 57, 58, 63, 66, 66, 67, 67, 68, 69, 70, 70, 70, 70, 72, 73, 75, 75, 76, 76, 78, 79, 81.
A box plot of the data can be generated by calculating five relevant values: minimum, maximum, median, first quartile, and third quartile.
The minimum is the smallest number of the set. In this case, the minimum day temperature is 57 °F.
The maximum is the largest number of the set. In this case, the maximum day temperature is 81 °F.
The median is the "middle" number of the ordered set. This means that there are exactly 50% of the elements less than the median and 50% of the elements greater than the median. The median of this ordered set is 70 °F.
The first quartile value is the number that marks one quarter of the ordered set. In other words, there are exactly 25% of the elements that are less than the first quartile and exactly 75% of the elements that are greater. The first quartile value can easily be determined by finding the "middle" number between the minimum and the median. For the hourly temperatures, the "middle" number between 57 °F and 70 °F is 66 °F.
The third quartile value is the number that marks three quarters of the ordered set. In other words, there are exactly 75% of the elements that are less than the third quartile and 25% of the elements that are greater. The third quartile value can be easily determined by finding the "middle" number between the median and the maximum. For the hourly temperatures, the "middle" number between 70 °F and 81 °F is 75 °F.
The interquartile range, or IQR, can be calculated:
Hence,
1.5 IQR above the third quartile is:
1.5IQR below the first quartile is:
The upper whisker of the box plot is the largest dataset number smaller than 1.5IQR above the third quartile. Here, 1.5IQR above the third quartile is 88.5 °F and the maximum is 81 °F. Therefore, the upper whisker is drawn at the value of the maximum, 81 °F.
Similarly, the lower whisker of the box plot is the smallest dataset number larger than 1.5IQR below the first quartile. Here, 1.5IQR below the first quartile is 52.5 °F and the minimum is 57 °F. Therefore, the lower whisker is drawn at the value of the minimum, 57 °F.
Example with outliers
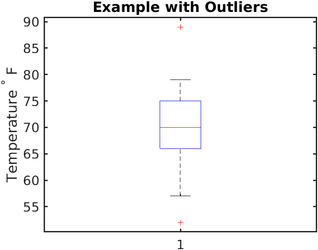
Above is an example without outliers. Here is a followup example with outliers:
The ordered set is: 52, 57, 57, 58, 63, 66, 66, 67, 67, 68, 69, 70, 70, 70, 70, 72, 73, 75, 75, 76, 76, 78, 79, 89.
In this example, only the first and the last number are changed. The median, third quartile, and first quartile remain the same.
In this case, the maximum is 89 °F and 1.5IQR above the third quartile is 88.5 °F. The maximum is greater than 1.5IQR plus the third quartile, so the maximum is an outlier. Therefore, the upper whisker is drawn at the greatest value smaller than 1.5IQR above the third quartile, which is 79 °F.
Similarly, the minimum is 52 °F and 1.5IQR below the first quartile is 52.5 °F. The minimum is smaller than 1.5IQR minus the first quartile, so the minimum is also an outlier. Therefore, the lower whisker is drawn at the smallest value greater than 1.5IQR below the first quartile, which is 57 °F.
In the case of large datasets
General equation to compute empirical quantiles
Using the example from above with 24 data points, meaning n = 24, one can also calculate the median, first and third quartile mathematically vs. visually.
Median :
First quartile :
Third quartile :
Visualization
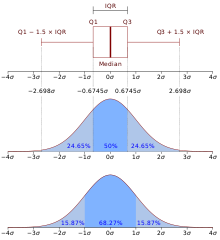
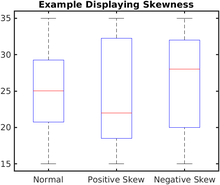
The box plot allows quick graphical examination of one or more data sets. Box plots may seem more primitive than a histogram or kernel density estimate but they do have some advantages. They take up less space and are therefore particularly useful for comparing distributions between several groups or sets of data (see Figure 1 for an example). Choice of number and width of bins techniques can heavily influence the appearance of a histogram, and choice of bandwidth can heavily influence the appearance of a kernel density estimate.
As looking at a statistical distribution is more commonplace than looking at a box plot, comparing the box plot against the probability density function (theoretical histogram) for a normal N(0,σ2) distribution may be a useful tool for understanding the box plot (Figure 7).
See also
- Bivariate boxplot
- Candlestick chart
- Exploratory data analysis
- Fan chart
- Five-number summary
- Functional boxplot
- Seven-number summary
References
- ^ Spear, Mary Eleanor (1952). Charting Statistics. McGraw Hill. p. 166.
- ^ Spear, Mary Eleanor. (1969). Practical charting techniques. New York: McGraw-Hill. ISBN 0070600104. OCLC 924909765.
- ^ Wickham, Hadley; Stryjewski, Lisa. "40 years of boxplots" (PDF). Retrieved December 24, 2020.
- ^ Holmes, Alexander; Illowsky, Barbara; Dean, Susan. "Introductory Business Statistics". OpenStax.
- ^ Dekking, F.M. (2005). A Modern Introduction to Probability and Statistics. Springer. pp. 234–238. ISBN 1-85233-896-2.
- ^ Frigge, Michael; Hoaglin, David C.; Iglewicz, Boris (February 1989). "Some Implementations of the Boxplot". The American Statistician. 43 (1): 50–54. doi:10.2307/2685173. JSTOR 2685173.
- ^ Marmolejo-Ramos, F.; Tian, S. (2010). "The shifting boxplot. A boxplot based on essential summary statistics around the mean". International Journal of Psychological Research. 3 (1): 37–46. doi:10.21500/20112084.823.
- ^ a b c McGill, Robert; Tukey, John W.; Larsen, Wayne A. (February 1978). "Variations of Box Plots". The American Statistician. 32 (1): 12–16. doi:10.2307/2683468. JSTOR 2683468.
- ^ "R: Box Plot Statistics". R manual. Retrieved 26 June 2011.
- ^ Hubert, M.; Vandervieren, E. (2008). "An adjusted boxplot for skewed distribution". Computational Statistics and Data Analysis. 52 (12): 5186–5201. CiteSeerX 10.1.1.90.9812. doi:10.1016/j.csda.2007.11.008.
- ^ Wickham, Hadley; Stryjewski, Lisa (2011). "40 years of boxplots" (PDF).
Further reading
- John W. Tukey (1977). Exploratory Data Analysis. Addison-Wesley.
- Benjamini, Y. (1988). "Opening the Box of a Boxplot". The American Statistician. 42 (4): 257–262. doi:10.2307/2685133. JSTOR 2685133.
- Rousseeuw, P. J.; Ruts, I.; Tukey, J. W. (1999). "The Bagplot: A Bivariate Boxplot". The American Statistician. 53 (4): 382–387. doi:10.2307/2686061. JSTOR 2686061.
External links
- On-line box plot calculator with explanations and examples (Has beeswarm example)
- Beeswarm Boxplot - superimposing a frequency-jittered stripchart on top of a box plot
- Complex online box plot creator with example data - see also BoxPlotR: a web tool for generation of box plots Spitzer et al. Nature Methods 11, 121–122 (2014)


![{\displaystyle {\text{with }}k=[p(n+1)]{\text{ and }}\alpha =p(n+1)-k}](https://wikimedia.org/api/rest_v1/media/math/render/svg/9c7fe0c9d05a9554dfbbd8dee8a39f0d779c1d39)


