
File:Hoover dam electricity generation since 2000.svg

Original file (SVG file, nominally 567 × 319 pixels, file size: 14 KB)
| This is a file from the Wikimedia Commons. Information from its description page there is shown below. Commons is a freely licensed media file repository. You can help. |
Summary
| Description |
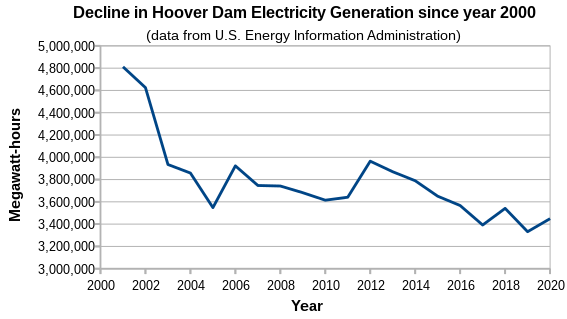
English: This image shows the decline in annual electricity generation at Hoover dam since year 2000. Installed generating capacity is equally split between the states of Arizona and Nevada. Total electricity generation for the two states in any year is not equal.
Data is from the U.S. Energy Information Administration: Year Total Mwh Arizona Nevada |
| Date | |
| Source | Own work |
| Author | Bikesrcool |
| Camera location | | View this and other nearby images on: OpenStreetMap |
|---|
Licensing
- You are free:
- to share – to copy, distribute and transmit the work
- to remix – to adapt the work
- Under the following conditions:
- attribution – You must give appropriate credit, provide a link to the license, and indicate if changes were made. You may do so in any reasonable manner, but not in any way that suggests the licensor endorses you or your use.
- share alike – If you remix, transform, or build upon the material, you must distribute your contributions under the same or compatible license as the original.
File history
Click on a date/time to view the file as it appeared at that time.
| Date/Time | Thumbnail | Dimensions | User | Comment | |
|---|---|---|---|---|---|
| current | 13:45, 15 June 2021 | | 567 × 319 (14 KB) | Bikesrcool | fix data credit |
| 12:52, 15 June 2021 |  | 567 × 319 (14 KB) | Bikesrcool | Uploaded own work with UploadWizard |
File usage
Global file usage
The following other wikis use this file:
- Usage on he.wikipedia.org