
List of parliamentary constituencies in Hertfordshire

The county of Hertfordshire in England is divided into eleven parliamentary constituencies. Each of the eleven elects a Member of Parliament (MP) to represent it at the United Kingdom (UK) Parliament in Westminster. As of the 2019 general election, ten of Hertfordshire's eleven MPs are Conservatives. The county currently has two urban borough constituencies (BC) – Broxbourne and Watford – while the other nine are classed as more rural county constituencies (CC).
Constituencies[edit]

Limits of the seats were amended by the Fifth Periodic Review of Westminster constituencies carried out by the Boundary Commission for England for future elections which have included 2010, 2015, 2017 and 2019. Each constituency is made up of whole or partial local government wards, which elect councillors at English local elections. Nine are designated as county constituencies (in which candidates can spend more per head than their borough counterparts). Two are borough constituencies.
[1] Conservative † Labour ‡ Liberal Democrat ¤
| Name[nb 1] | Electorate[2] | Majority[3][nb 2] | Member of Parliament[3] | Nearest opposition[3] | Map | ||
|---|---|---|---|---|---|---|---|
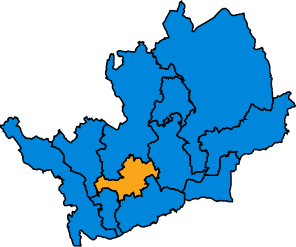
| Broxbourne BC | 73,182 | 19,807 | Charles Walker †[4] | Sean Waters ‡ |  | ||
| Hemel Hempstead CC | 74,035 | 14,563 | Michael Penning † | Nabila Ahmed ‡ |  | ||
| Hertford and Stortford CC | 81,765 | 19,620 | Julie Marson † | Chris Vince ‡ |  | ||
| Hertsmere CC | 73,971 | 21,313 | Oliver Dowden † | Holly Kal-Weiss ‡ |  | ||
| Hitchin and Harpenden CC | 76,323 | 6,895 | Bim Afolami † | Sam Collins ¤ |  | ||
| North East Hertfordshire CC | 76,123 | 18,189 | Oliver Heald † | Kelley Green ‡ |  | ||
| South West Hertfordshire CC | 80,499 | 14,408 | Gagan Mohindra † | David Gauke |  | ||
| St Albans CC | 73,727 | 6,293 | Daisy Cooper ¤ | Anne Main † |  | ||
| Stevenage CC | 71,562 | 8,562 | Stephen McPartland † | Jill Borcherds ‡ |  | ||
| Watford BC | 83,359 | 4,433 | Dean Russell † | Chris Ostrowski ‡ |  | ||
| Welwyn Hatfield CC | 74,892 | 10,955 | Grant Shapps † | Rosie Newbigging ‡ |  | ||
2010 boundary changes[edit]
The Boundary Commission for England decided not to change Hertfordshire's representation in Parliament for the 2010 election. It did however suggest slight boundary changes to reduce electoral disparity. The recommendations, which became law with the Parliamentary Constituencies (England) Order 2007, also ensured that local government wards in Hertfordshire would no longer be split between two Parliamentary constituencies.[5][6]
| Name | Boundaries 1997-2010 | Boundaries 2010–present | |
|---|---|---|---|
| 1 | Broxbourne BC |  |
 |
| 2 | Hemel Hempstead CC | ||
| 3 | Hertford and Stortford CC | ||
| 4 | Hertsmere CC | ||
| 5 | Hitchin and Harpenden CC | ||
| 6 | North East Hertfordshire CC | ||
| 7 | South West Hertfordshire CC | ||
| 8 | St Albans CC | ||
| 9 | Stevenage CC | ||
| 10 | Watford BC | ||
| 11 | Welwyn Hatfield CC |
Proposed boundary changes[edit]
See 2023 Periodic Review of Westminster constituencies for further details.
Following the abandonment of the Sixth Periodic Review (the 2018 review), the Boundary Commission for England formally launched the 2023 Review on 5 January 2021.[7] Initial proposals were published on 8 June 2021 and, following two periods of public consultation, revised proposals were published on 8 November 2022. The final proposals were published on 28 June 2023.
The commission has proposed that Hertfordshire be combined with Bedfordshire as a sub-region of the Eastern Region, with the creation of the cross-county boundary constituency of Hitchin. As a result of the changes, Hitchin and Harpenden would be abolished and replaced by a new constituency named Harpenden and Berkhamsted.[8][9][10]
The following seats are proposed:
Containing electoral wards in Broxbourne
- Broxbourne (part)
Containing electoral wards in Dacorum
- Harpenden and Berkhamsted (part)
- Hemel Hempstead
- South West Hertfordshire (part)
Containing electoral wards in East Hertfordshire
- Broxbourne (part)
- Hertford and Stortford
- North East Hertfordshire (part)
- Stevenage (part)
Containing electoral wards in Hertsmere
Containing electoral wards in North Hertfordshire
- Hitchin (part also in Central Bedfordshire)
- North East Hertfordshire (part)
- Stevenage (part)
Containing electoral wards in St Albans
- Harpenden and Berkhamsted (part)
- St Albans
Containing electoral wards in Stevenage
- Stevenage (part)
Containing electoral wards in Three Rivers
- South West Hertfordshire (part)
Containing electoral wards in Watford
- Watford (part)
Containing electoral wards in Welwyn Hatfield
- Hertsmere (part)
- Welwyn Hatfield
Results history[edit]
Primary data source: House of Commons research briefing - General election results from 1918 to 2019[11]
2019[edit]
The number of votes cast for each political party who fielded candidates in constituencies comprising Hertfordshire in the 2019 general election were as follows:
| Party | Votes | % | Change from 2017 | Seats | Change from 2017 |
|---|---|---|---|---|---|
| Conservative | 317,018 | 52.7% | 10 | ||
| Labour | 141,143 | 23.5% | 0 | 0 | |
| Liberal Democrats | 110,006 | 18.3% | 1 | ||
| Greens | 15,132 | 2.5% | 0 | 0 | |
| Others | 17,764 | 3.0% | 0 | 0 | |
| Total | 601,063 | 100.0 | 11 |
Percentage votes[edit]
| Election year | 1974
(Feb) |
1974
(Oct) |
1979 | 1983 | 1987 | 1992 | 1997 | 2001 | 2005 | 2010 | 2015 | 2017 | 2019 |
|---|---|---|---|---|---|---|---|---|---|---|---|---|---|
| Conservative | 40.4 | 41.3 | 51.1 | 50.3 | 52.0 | 53.3 | 40.6 | 41.8 | 44.8 | 50.4 | 52.6 | 54.3 | 52.7 |
| Labour | 35.0 | 38.5 | 34.4 | 19.0 | 19.8 | 25.5 | 39.7 | 38.9 | 30.2 | 19.0 | 22.4 | 32.1 | 23.5 |
| Liberal Democrat1 | 24.4 | 19.8 | 13.2 | 30.2 | 27.8 | 20.3 | 16.0 | 16.9 | 21.4 | 24.0 | 8.7 | 9.9 | 18.3 |
| Green Party | - | - | - | - | * | * | * | * | * | 0.8 | 3.6 | 2.3 | 2.5 |
| UKIP | - | - | - | - | - | - | * | * | * | 3.3 | 12.5 | 1.2 | * |
| Other | 0.2 | 0.4 | 1.3 | 0.5 | 0.4 | 0.9 | 3.7 | 2.4 | 3.6 | 2.5 | 0.2 | 0.2 | 3.0 |
11974 & 1979 - Liberal Party; 1983 & 1987 - SDP-Liberal Alliance
* Included in Other
Seats[edit]
| Election year | 1974
(Feb) |
1974
(Oct) |
1979 | 1983 | 1987 | 1992 | 1997 | 2001 | 2005 | 2010 | 2015 | 2017 | 2019 |
|---|---|---|---|---|---|---|---|---|---|---|---|---|---|
| Conservative | 7 | 5 | 9 | 10 | 10 | 10 | 6 | 6 | 9 | 11 | 11 | 11 | 10 |
| Labour | 2 | 4 | 0 | 0 | 0 | 0 | 5 | 5 | 2 | 0 | 0 | 0 | 0 |
| Liberal Democrat1 | 0 | 0 | 0 | 0 | 0 | 0 | 0 | 0 | 0 | 0 | 0 | 0 | 1 |
| Total | 9 | 9 | 9 | 10 | 10 | 10 | 11 | 11 | 11 | 11 | 11 | 11 | 11 |
11974 & 1979 - Liberal Party; 1983 & 1987 - SDP-Liberal Alliance
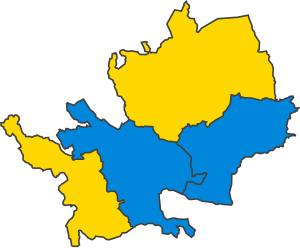
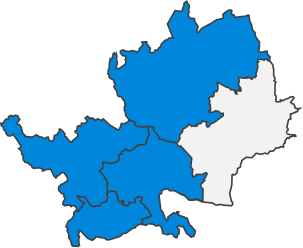
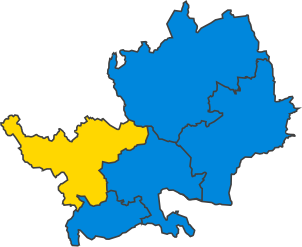
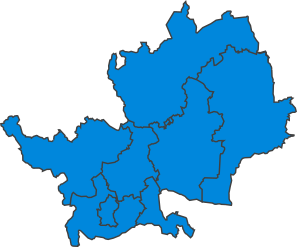
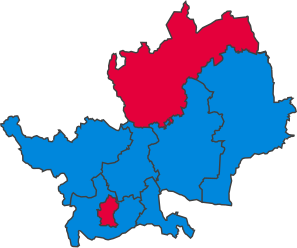
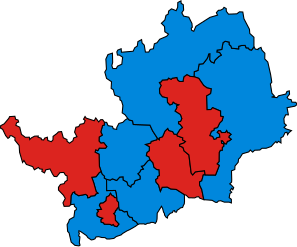
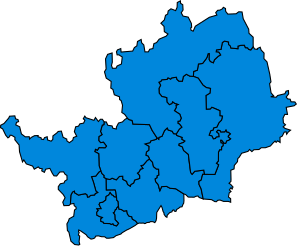
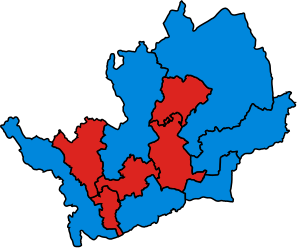
Maps[edit]
1885-1910[edit]
-
 1885
1885 -
1886
-
1892
-
1895
-
1900
-
 1906
1906 -
Jan 1910
-
Dec 1910


1918-1945[edit]
-
 1918
1918 -
 1922
1922 -
 1923
1923 -
1924
-
1929
-
1931
-
1935
-
 1945
1945


1950-1970[edit]
-
 1950
1950 -
1951
-
 1955
1955 -
1959
-
 1964
1964 -
1966
-
1970


1974-present[edit]
-
 Feb 1974
 -
 Oct 1974
 -
 1979
1979 -
 1983
1983 -
1987
-
1992
-
 1997
1997 -
2001
-
 2005
2005 -
 2010
2010 -
2015
-
2017
-
 2019
2019


Timeline[edit]
- Former constituency
- * Constituency for the 2017 United Kingdom general election
| Constituency | Years | |||||||||||
|---|---|---|---|---|---|---|---|---|---|---|---|---|
| 1290–1298 | 1298–1307 | 1307–1852 | 1852–1885 | 1885–1918 | 1918–1945 | 1945–1950 | 1950–1955 | 1955–1974 | 1974–1983 | 1983–1997 | 1997–* | |
| Hertfordshire[12] | 1290–1885 | |||||||||||
| Hertford[12][13] | 1298–1974 | |||||||||||
| St Albans[nb 3][12][13] | 1307–1852 | 1885–* | ||||||||||
| Watford[13] | 1885–* | |||||||||||
| Hitchin[13] | 1885–1983 | |||||||||||
| Hemel Hempstead[14] | 1918–1983 | 1997–* | ||||||||||
| Barnet | 1945–1974 | Part of Greater London from 1965 | ||||||||||
| South West Hertfordshire[15][16] | 1950–* | |||||||||||
| East Hertfordshire[17] | 1955–1983 | |||||||||||
| Hertford and Stevenage | 1974–1983 | |||||||||||
| South Hertfordshire | 1974–1983 | |||||||||||
| Welwyn Hatfield | 1974–* | |||||||||||
| North Hertfordshire | 1983–1997 | |||||||||||
| West Hertfordshire | 1983–1997 | |||||||||||
| Broxbourne | 1983–* | |||||||||||
| Hertford and Stortford | 1983–* | |||||||||||
| Hertsmere | 1983–* | |||||||||||
| Stevenage | 1983–* | |||||||||||
| Hitchin and Harpenden | 1997–* | |||||||||||
| North East Hertfordshire | 1997–* | |||||||||||
Historical representation by party[edit]
A cell marked → (with a different colour background to the preceding cell) indicates that the previous MP continued to sit under a new party name.
1885 to 1918[edit]
Conservative Independent Liberal
| Constituency | 1885 | 1886 | 1892 | 1895 | 98 | 1900 | 04 | 1906 | Jan 10 | Dec 10 | 11 | 16 |
|---|---|---|---|---|---|---|---|---|---|---|---|---|
| Hertford | A. Smith | E. Cecil | A. H. Smith | Rolleston | Billing | |||||||
| Hitchin | Dimsdale | Hudson | Bertram | Hillier | R. Cecil | |||||||
| St Albans | J. W. Grimston | Gibbs | Slack | Carlile | ||||||||
| Watford | Halsey | Micklem | Ward | |||||||||
1918 to 1955[edit]
Anti-Waste League Conservative Independent Labour Liberal Silver Badge
| Constituency | 1918 | 19 | 20 | 21 | 1922 | 1923 | 1924 | 1929 | 1931 | 33 | 1935 | 37 | 41 | 43 | 1945 | 1950 | 1951 |
|---|---|---|---|---|---|---|---|---|---|---|---|---|---|---|---|---|---|
| Hertford | Billing | Sueter | → | Walker-Smith | |||||||||||||
| Hitchin | R. Cecil | Kindersley | Knebworth | Wilson | Berry | Jones | Fisher | ||||||||||
| St Albans | Carlile | Fremantle | J. Grimston | Dumpleton | J. Grimston | ||||||||||||
| Watford | Herbert | Freeman | |||||||||||||||
| Hemel Hempstead | Talbot | J. Davidson | Dunn | J. Davidson | F. Davidson | ||||||||||||
| Barnet | Taylor | Maudling | |||||||||||||||
| Hertfordshire SW | Longden | ||||||||||||||||
1955 to present[edit]
Conservative Independent Labour Liberal Democrats
| Constituency | 1955 | 1959 | 1964 | 1966 | 1970 | Feb 1974 | Oct 1974 | 1979 | 79 | 1983 | 1987 | 1992 | 1997 | 2001 | 2005 | 2010 | 2015 | 2017 | 19 | 2019 |
|---|---|---|---|---|---|---|---|---|---|---|---|---|---|---|---|---|---|---|---|---|
| Barnet | Maudling | Transferred to Greater London | ||||||||||||||||||
| Hemel Hempstead (1945–83, 97-) / W Herts (1983) | Davidson | Allason | Corbett | Lyell | Jones | McWalter | Penning | |||||||||||||
| Hertford / & Stevenage (1974) / H & Stortford (1983) | Lindsay | Williams | Wells | Prisk | Marson | |||||||||||||||
| Hitchin / North Herts (1983) / NE Herts (1997) | Maddan | Williams | Stewart | Heald | ||||||||||||||||
| St Albans | Grimston | Goodhew | Lilley | Pollard | Main | Cooper | ||||||||||||||
| Watford | Farey-Jones | Tuck | Garel-Jones | Ward | Harrington | Russell | ||||||||||||||
| Hertfordshire SW | Longden | Dodsworth | Page | Gauke | → | Mohindra | ||||||||||||||
| Hertfordshire E / Broxbourne (1983) | Walker-Smith | Roe | Walker | |||||||||||||||||
| Hertfordshire South / Hertsmere (1983) | Parkinson | Clappison | Dowden | |||||||||||||||||
| Welwyn and Hatfield | Lindsay | Hayman | Murphy | Evans | Johnson | Shapps | ||||||||||||||
| Stevenage | Wood | Follett | McPartland | |||||||||||||||||
| Hitchin and Harpenden | Lilley | Afolami | ||||||||||||||||||
See also[edit]
- List of parliamentary constituencies in the East of England (region)
- History of parliamentary constituencies and boundaries in Hertfordshire
- East of England (European Parliament constituency)
- Hertfordshire County Council
- Hertfordshire local elections
Footnotes[edit]
References[edit]
- General
- "Boundary Commission for England: Fifth Periodical Report" (PDF). Boundary Commission for England. Crown Copyright. 2007. Archived from the original (PDF) on 26 July 2011. Retrieved 6 November 2009.
- Craig, Frederick Walter Scott (1972). Boundaries of Parliamentary Constituencies 1885–1972. Chichester, Sussex: Political Reference Publications. ISBN 0-900178-13-2.
- Robinson, Gwennah (1978). Barracuda Guide to County History, Vol III: Hertfordshire. Barracuda Books. ISBN 0-86023-030-9.
- Richard Hacker (13 February 2001). "Report on a local inquiry into the Parliamentary constituency boundaries for the county of Hertfordshire" (PDF). Archived from the original (PDF) on 28 January 2007. Retrieved 28 November 2009.
- Specific
- ^ "Variation of election expenses limits for candidates at UK Parliamentary and local government elections" (PDF). The Electoral Commission. Retrieved 26 November 2009.
- ^ Baker, Carl; Uberoi, Elise; Cracknell, Richard (28 January 2020). "General Election 2019: full results and analysis".
{{cite journal}}: Cite journal requires|journal=(help) - ^ a b c "Constituencies A-Z - Election 2019". BBC News. Retrieved 23 April 2020.
- ^ "Constituency:Broxbourne". BBC News. Retrieved 2 August 2010.
- ^ Boundary Commission for England pp. 346–350.
- ^ "The Parliamentary Constituencies (England) Order 2007". Office of Public Sector Information. Crown copyright. 13 June 2007. Archived from the original on 11 February 2010. Retrieved 7 November 2009.
- ^ "2023 Review | Boundary Commission for England". boundarycommissionforengland.independent.gov.uk. Retrieved 7 October 2021.
- ^ "Boundary proposals reveal brand new constituency - so is your MP changing?". Watford Observer. Retrieved 8 October 2021.
- ^ Adams, Matt (8 June 2021). "Harpenden constituency to go under proposed boundary changes". Herts Advertiser. Retrieved 8 October 2021.
- ^ "The 2023 Review of Parliamentary Constituency Boundaries in England – Volume one: Report | Boundary Commission for England". paras 207-234. Retrieved 9 July 2023.
- ^ Watson, Christopher; Uberoi, Elise; Loft, Philip (17 April 2020). "General election results from 1918 to 2019".
{{cite journal}}: Cite journal requires|journal=(help) - ^ a b c David Boothroyd. "Parliamentary Constituencies in the unreformed House". David Boothroyd. Retrieved 9 November 2009.
- ^ a b c d "Historic maps". David Rumsey Historical Map Collection. Retrieved 28 November 2009.
- ^ "Full text of "The Representation of the people act, 1918 : with explanatory notes"". Internet Archive. Retrieved 28 November 2009.
- ^ "UK General Election results July 1945". politicsresources.net. Archived from the original on 11 August 2011. Retrieved 29 November 2009.
- ^ "UK General Election results February 1950". politicsresources.net. Archived from the original on 11 August 2011. Retrieved 29 November 2009.
- ^ "UK General Election results May 1955". politicsresources.net. Archived from the original on 11 August 2011. Retrieved 29 November 2009.