
Mount Hebron, California
Mt. Hebron | |
|---|---|
 Location in Siskiyou County and the state of California | |
 Mt. Hebron Location in the United States | |
| Coordinates: 41°47′11″N 122°0′18″W / 41.78639°N 122.00500°W | |
| Country | |
| State | |
| County | |
| Area | |
| • Total | 0.713 sq mi (1.847 km2) |
| • Land | 0.713 sq mi (1.847 km2) |
| • Water | 0 sq mi (0 km2) 0% |
| Elevation | 4,262 ft (1,299 m) |
| Population (2020) | |
| • Total | 103 |
| • Density | 140/sq mi (56/km2) |
| Time zone | UTC-8 (Pacific (PST)) |
| • Summer (DST) | UTC-7 (PDT) |
| ZIP code | 96058 |
| Area code | 530 |
| FIPS code | 06-49768 |
| GNIS feature ID | 0263888 |
Mount Hebron is a census-designated place in Siskiyou County, California, United States. Its population is 103 as of the 2020 census, up from 95 from the 2010 census.
Geography[edit]
Mount Hebron is located at 41°47′11″N 122°0′18″W / 41.78639°N 122.00500°W (41.786373, −122.005132).[2]
According to the United States Census Bureau, the CDP has a total area of 0.7 square miles (1.8 km2), all of it land.
Climate[edit]
This region experiences warm (but not hot) and dry summers, with no average monthly temperatures above 71.6 °F. According to the Köppen Climate Classification system, Mount Hebron has a warm-summer Mediterranean climate, abbreviated "Csb" on climate maps.[3]
| Climate data for Mt. Hebron | |||||||||||||
|---|---|---|---|---|---|---|---|---|---|---|---|---|---|
| Month | Jan | Feb | Mar | Apr | May | Jun | Jul | Aug | Sep | Oct | Nov | Dec | Year |
| Record high °F (°C) | 60 (16) |
67 (19) |
75 (24) |
80 (27) |
91 (33) |
98 (37) |
102 (39) |
102 (39) |
100 (38) |
88 (31) |
76 (24) |
60 (16) |
102 (39) |
| Mean daily maximum °F (°C) | 41.1 (5.1) |
46.7 (8.2) |
52.0 (11.1) |
58.4 (14.7) |
65.5 (18.6) |
73.9 (23.3) |
82.5 (28.1) |
82.2 (27.9) |
74.5 (23.6) |
64.2 (17.9) |
48.9 (9.4) |
42.2 (5.7) |
65.5 (18.6) |
| Mean daily minimum °F (°C) | 15.4 (−9.2) |
19.6 (−6.9) |
23.2 (−4.9) |
26.0 (−3.3) |
32.1 (0.1) |
38.8 (3.8) |
42.3 (5.7) |
40.9 (4.9) |
34.0 (1.1) |
27.1 (−2.7) |
20.5 (−6.4) |
15.9 (−8.9) |
28.0 (−2.2) |
| Record low °F (°C) | −29 (−34) |
−13 (−25) |
−6 (−21) |
4 (−16) |
11 (−12) |
18 (−8) |
22 (−6) |
19 (−7) |
15 (−9) |
−2 (−19) |
−13 (−25) |
−23 (−31) |
−29 (−34) |
| Average precipitation inches (mm) | 1.97 (50) |
1.51 (38) |
1.27 (32) |
0.95 (24) |
1.08 (27) |
0.76 (19) |
0.43 (11) |
0.38 (9.7) |
0.49 (12) |
0.95 (24) |
1.98 (50) |
2.10 (53) |
13.85 (352) |
| Average snowfall inches (cm) | 4.3 (11) |
2.4 (6.1) |
3.4 (8.6) |
1.0 (2.5) |
0.2 (0.51) |
0.1 (0.25) |
0.0 (0.0) |
0.0 (0.0) |
0.0 (0.0) |
0.1 (0.25) |
2.4 (6.1) |
3.8 (9.7) |
17.7 (45.01) |
| Source: WRCC[4] | |||||||||||||
Demographics[edit]
2010[edit]
The 2010 United States Census[5] reported that Mount Hebron had a population of 95. The population density was 133.2 inhabitants per square mile (51.4/km2). The racial makeup of Mount Hebron was 73 (76.8%) White, 0 (0.0%) African American, 1 (1.1%) Native American, 0 (0.0%) Asian, 0 (0.0%) Pacific Islander, 18 (18.9%) from other races, and 3 (3.2%) from two or more races. Hispanic or Latino of any race were 41 persons (43.2%).
The Census reported that 93 people (97.9% of the population) lived in households, 2 (2.1%) lived in non-institutionalized group quarters, and 0 (0%) were institutionalized.
There were 32 households, out of which 11 (34.4%) had children under the age of 18 living in them, 16 (50.0%) were opposite-sex married couples living together, 3 (9.4%) had a female householder with no husband present, 1 (3.1%) had a male householder with no wife present. There were 0 (0%) unmarried opposite-sex partnerships, and 0 (0%) same-sex married couples or partnerships. 11 households (34.4%) were made up of individuals, and 8 (25.0%) had someone living alone who was 65 years of age or older. The average household size was 2.91. There were 20 families (62.5% of all households); the average family size was 3.30.
The population was spread out, with 17 people (17.9%) under the age of 18, 8 people (8.4%) aged 18 to 24, 29 people (30.5%) aged 25 to 44, 25 people (26.3%) aged 45 to 64, and 16 people (16.8%) who were 65 years of age or older. The median age was 42.3 years. For every 100 females, there were 131.7 males. For every 100 females age 18 and over, there were 151.6 males.
There were 43 housing units at an average density of 60.3 per square mile (23.3/km2), of which 24 (75.0%) were owner-occupied, and 8 (25.0%) were occupied by renters. The homeowner vacancy rate was 0%; the rental vacancy rate was 27.3%. 52 people (54.7% of the population) lived in owner-occupied housing units and 41 people (43.2%) lived in rental housing units.
2000[edit]
As of the census[6] of 2000, there were 92 people, 35 households, and 26 families residing in the CDP. The population density was 128.0 inhabitants per square mile (49.4/km2). There were 43 housing units at an average density of 59.8 per square mile (23.1/km2). The racial makeup of the CDP was 73.91% White, 2.17% Native American, 21.74% from other races, and 2.17% from two or more races. Hispanic or Latino of any race were 28.26% of the population.
There were 35 households, out of which 34.3% had children under the age of 18 living with them, 57.1% were married couples living together, 11.4% had a female householder with no husband present, and 25.7% were non-families. 25.7% of all households were made up of individuals, and 5.7% had someone living alone who was 65 years of age or older. The average household size was 2.63 and the average family size was 3.04.
In the CDP, the population was spread out, with 26.1% under the age of 18, 9.8% from 18 to 24, 34.8% from 25 to 44, 18.5% from 45 to 64, and 10.9% who were 65 years of age or older. The median age was 32 years. For every 100 females, there were 100.0 males. For every 100 females age 18 and over, there were 119.4 males.
The median income for a household in the CDP was $22,188, and the median income for a family was $25,625. Males had a median income of $31,250 versus $11,250 for females. The per capita income for the CDP was $16,556. There were 10.5% of families and 22.5% of the population living below the poverty line, including 18.2% of under eighteens and 33.3% of those over 64.
Politics[edit]
In the state legislature Mount Hebron is in the 1st Senate District, represented by Republican Brian Dahle,[7] and the 1st Assembly District, represented by Republican Megan Dahle.[8]
Federally, Mount Hebron is in California's 1st congressional district, represented by Republican Doug LaMalfa.[9]
References[edit]
- ^ U.S. Census Archived 2012-07-02 at the Wayback Machine
- ^ "US Gazetteer files: 2010, 2000, and 1990". United States Census Bureau. February 12, 2011. Retrieved April 23, 2011.
- ^ Climate Summary for Mount Hebron, California
- ^ "MT HEBRON RNG STN, CALIFORNIA - Climate Summary". Western Regional Climate Center. Retrieved November 29, 2015.
- ^ "2010 Census Interactive Population Search: CA – Mount Hebron CDP". U.S. Census Bureau. Archived from the original on July 15, 2014. Retrieved July 12, 2014.
- ^ "U.S. Census website". United States Census Bureau. Retrieved January 31, 2008.
- ^ "Senators". State of California. Retrieved March 10, 2013.
- ^ "Members Assembly". State of California. Retrieved March 2, 2013.
- ^ "California's 1st Congressional District - Representatives & District Map". Civic Impulse, LLC. Retrieved March 1, 2013.
Municipalities and communities of Siskiyou County, California, United States | ||
|---|---|---|
| Cities | 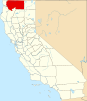 | |
| CDPs | ||
| Unincorporated communities | ||
| Indian reservation | ||
| Ghost towns | ||
| Footnotes | ‡This populated place also has portions in an adjacent county or counties | |