Ohio's 1st congressional district
Appearance
| Ohio's 1st congressional district | |
|---|---|
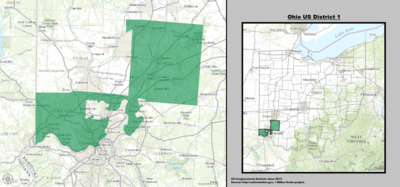 Ohio's 1st congressional district - since January 3, 2013. | |
| Representative | |
| Distribution |
|
| Population (2010) | 731,181[1] |
| Median household income | 50,069 |
| Ethnicity |
|
| Cook PVI | R+6 |
Ohio's 1st congressional district is represented by Republican Steve Chabot. This district includes parts of Cincinnati, and borders both Kentucky and Indiana.
Cities
Cincinnati (partial)
Cheviot
Forest Park
Harrison
Indian Hill
Springdale
St. Bernard
Mason
Lebanon
Sharonville
List of representatives
Recent election results
The following chart shows recent election results. Bold name indicates winner. Italic name indicates incumbent.
| Year | Democratic | Republican | Other |
|---|---|---|---|
| 1920 | John H. Allen: 40,195 | Nicholas Longworth: 57,328 | Edward L. Hutchins (FL): 926 Eli G. Frankenstein: 1,134 |
| 1922 | Sidney G. Stricker: 30,945 | Nicholas Longworth: 45,253 | Edward L. Hutchins (FL): 3,094 |
| 1924 | Thomas B. Paxton: 36,065 | Nicholas Longworth: 58,125 | |
| 1926 | John C. Rogers: 26,511 | Nicholas Longworth: 45,317 | Edward D. Colley: 268 |
| 1928 | Arthur Espy: 49,880 | Nicholas Longworth: 80,812 | |
| 1930 | John W. Pattison: 46,974 | Nicholas Longworth: 50,481 | |
| 1932 | Edward H. Brink: 55,416 | John B. Hollister*: 66,018 | |
| 1934 | Edwin G. Becker: 42,723 | John B. Hollister: 53,985 | |
| 1936 | Joseph A. Dixon: 71,935 | John B. Hollister: 66,082 | |
| 1938 | Joseph A. Dixon: 45,536 | Charles H. Elston: 63,285 | |
| 1940 | Joseph A. Dixon: 61,382 | Charles H. Elston: 84,622 | |
| 1942 | William H. Hessler: 33,884 | Charles H. Elston: 54,120 | |
| 1944 | Frank J. Richter: 62,617 | Charles H. Elston: 82,373 | |
| 1946 | G. Andrews Espy: 40,594 | Charles H. Elston: 72,909 | |
| 1948 | Morse Johnson: 69,240 | Charles H. Elston: 73,952 | |
| 1950 | Rollin H. Everett: 53,760 | Charles H. Elston: 77,507 | |
| 1952 | Walter A. Kelly: 60,015 | Gordon H. Scherer: 96,385 | |
| 1954 | Mrs. Warwick B. Hobart: 39,421 | Gordon H. Scherer: 71,042 | |
| 1956 | Leonard D. Slutz: 49,701 | Gordon H. Scherer: 91,181 | |
| 1958 | W. Ted Osborne: 54,119 | Gordon H. Scherer: 70,686 | |
| 1960 | W. Ted Osborne: 62,043 | Gordon H. Scherer: 88,899 | |
| 1962 | Monica Nolan: 44,264 | Carl W. Rich: 74,320 | |
| 1964 | John J. Gilligan: 74,525 | Carl W. Rich: 69,114 | |
| 1966 | John J. Gilligan: 62,580 | Robert Taft Jr.: 70,366 | |
| 1968 | Carl F. Heiser: 49,830 | Robert Taft Jr.: 102,219 | |
| 1970 | Bailey W. Turner: 39,820 | William J. Keating: 89,169 | |
| 1972 | Carl F. Heiser: 50,575 | William J. Keating: 119,469 | |
| 1974 | Thomas A. Luken*: 67,685 | Willis D. Gradison Jr.: 70,284 | |
| 1976 | William F. Bowen: 56,995 | Willis D. Gradison Jr.: 109,789 | Christopher L. Martinson: 2,732 |
| 1978 | Timothy M. Burke: 38,669 | Willis D. Gradison Jr.: 73,593 | Joseph E. May: 1,907 |
| 1980 | Donald J. Zwick: 38,529 | Willis D. Gradison Jr.*: 124,080 | Scott A. Breen: 3,571 |
| 1982 | Thomas A. Luken*: 99,143 | John E. Held: 52,658 | Jim Berms (L): 4,386 |
| 1984 | Thomas A. Luken: 121,577 | Norman A. Murdock: 88,859 | Other: 10,222 |
| 1986 | Thomas A. Luken: 90,477 | Fred E. Morr: 56,100 | |
| 1988 | Thomas A. Luken: 117,628 | Steve Chabot: 90,738 | |
| 1990 | Charles J. Luken: 83,932 | Ken Blackwell: 80,362 | |
| 1992 | David S. Mann: 120,190 | Stephen Grote: 101,498 | Jim Berns: 12,734 |
| 1994 | David S. Mann: 72,822 | Steve Chabot: 92,997 | |
| 1996 | Mark P. Longabaugh: 94,719 | Steve Chabot: 118,324 | John G. Halley (N): 5,381 |
| 1998 | Roxanne Qualls: 82,003 | Steve Chabot: 92,421 | |
| 2000 | John Cranley: 98,328 | Steve Chabot: 116,768 | David A. Groshoff (L): 3,399 Richard L. Stevenson (N): 1,933 |
| 2002 | Greg Harris: 60,168 | Steve Chabot: 110,760 | |
| 2004 | Greg Harris: 116,320 | Steve Chabot: 167,991 | |
| 2006 | John Cranley: 90,963 | Steve Chabot: 101,838 | |
| 2008 | Steve Driehaus: 155,089 | Steve Chabot: 140,469 | Eric Wilson: 84, Rich Stevenson: 67 |
| 2010[2] | Steve Driehaus: 92,672 | Steve Chabot: 103,770 | Jim Berns: 3,076, Rich Stevenson: 2000 |
| 2012[3] | Jeff Sinnard: 131,490 | Steve Chabot: 201,907 | Jim Berns (L) : 9,674 Rich Stevenson (G) : 6,654 |
| 2014[4] | Fred Kundrata: 72,604 | Steve Chabot: 124,779 |
2010
| Party | Candidate | Votes | % | |||
|---|---|---|---|---|---|---|
| Republican | Steve Chabot | 103,770 | 51.49 | |||
| Democratic | Steve Driehaus* | 92,672 | 45.99 | |||
| Libertarian | Jim Berns | 3,076 | 1.53 | |||
| Green | Rich Stevenson | 2,000 | 0.99 | |||
| Total votes | 201,518 | 100.00 | ||||
| Turnout | ||||||
| Republican gain from Democratic | ||||||
Competitiveness
Election results from presidential races:
| Year | Office | Results |
|---|---|---|
| 2000 | President | George W. Bush 51 - Al Gore 46% |
| 2004 | President | George W. Bush 51 - John Kerry 49% |
| 2008 | President | Barack Obama 55 - John McCain 44% |
| 2012 | President | Mitt Romney 52 - Barack Obama 46% |
Historical district boundaries

See also
References
- Martis, Kenneth C. (1989). The Historical Atlas of Political Parties in the United States Congress. New York: Macmillan Publishing Company.
{{cite book}}: Cite has empty unknown parameter:|coauthors=(help) - Martis, Kenneth C. (1982). The Historical Atlas of United States Congressional Districts. New York: Macmillan Publishing Company.
{{cite book}}: Cite has empty unknown parameter:|coauthors=(help) - Congressional Biographical Directory of the United States 1774–present
- ^ "My Congressional District". United States Census Bureau. Retrieved 2013-03-05.
- ^ "Representative to Congress: November 2, 2010." Ohio Secretary of State. Retrieved April 1, 2011
- ^ "2012 Election Results". Ohio Secretary of State.
- ^ [1] Ohio Secretary of State. Retrieved February 27, 2015


