
Relative currency strength
This article needs additional citations for verification. (December 2023) |
Relative currency strength (RCS) is the purchasing power of a currency when traded against other foreign currencies, or used to trade products.[1] It is also a technical indicator used in the technical analysis of foreign exchange market (Forex). It is intended to chart the current and historical strength or weakness of a currency based on the closing prices of a recent trading period. It is based on the relative strength index and mathematical decorrelation of 28 cross currency pairs. It shows the relative strength momentum of the selected major currency. (EUR, GBP, AUD, USD, CAD, CHF, JPY)
The RCS is typically used on a 14-period timeframe, and is measured on a scale from 0 to 100 similar to RSI, with high and low levels marked at 70 and 30, respectively. Shorter or longer timeframes are used for alternately shorter or longer outlooks. More extreme high and low levels—such as 80 and 20, or 90 and 10—occur less frequently but indicate stronger momentum of currency.
Combination of Relative currency strength and Absolute currency strength indicators yield entry and exit signals for currency trading.
Basic idea[edit]
The basic idea behind this indicator is to be able to "buy strong currency and sell weak currency". If a X/Y currency pair is in an uptrend, the RCS indicator shows if it is due to either X strength or Y weakness.
Using these signals a trader can evaluate and determine the most worthy pair to trade.
Signals[edit]
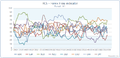
You can use Relative currency strength for pattern trading as well. Some of the basic patterns where RCS can be used are: cross, trend break, trend follow, and divergencies.
-
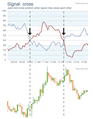 Cross
Cross -
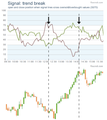 Trend-break
 -
 Divergence


Indicator[edit]
-
 Combination of Relative currency strength and Absolute currency strength
 -

Advantageous for trading strategies[edit]
- Most commonly used in combination with Absolute currency strength.
- Information indicator to realize which currencies are being demanded, this is ideal indicator for trend following traders.
- Help for scalpers looking for strength trend (trader can see both absolute and relative strength).
- Instrument for correlation/spread traders to see reactions of each currencies on moves in correlated instruments (for example CAD/OIL or AUD/GOLD).
See also[edit]
- Absolute currency strength
- Currency strength
- Currency pair
- Relative Strength Index
- Forex
- Technical analysis
References[edit]
- ^ "How To Compare The Relative Strength Of Currencies". Finance Monthly | Monthly Finance News Magazine. 2022-02-28. Retrieved 2023-11-10.