
Scurry County, Texas
Scurry County | |
|---|---|
 Scurry County Courthouse in Snyder | |
 Location within the U.S. state of Texas | |
 Texas's location within the U.S. | |
| Coordinates: 32°45′N 100°55′W / 32.75°N 100.92°W | |
| Country | |
| State | |
| Founded | 1884 |
| Named for | William Read Scurry |
| Seat | Snyder |
| Largest city | Snyder |
| Area | |
| • Total | 908 sq mi (2,350 km2) |
| • Land | 905 sq mi (2,340 km2) |
| • Water | 2.1 sq mi (5 km2) 0.2% |
| Population (2010) | |
| • Total | 16,921 |
| • Density | 19/sq mi (7/km2) |
| Time zone | UTC−6 (Central) |
| • Summer (DST) | UTC−5 (CDT) |
| Congressional district | 19th |
| Website | www |

Scurry County is a county located in the U.S. state of Texas. As of the 2010 census, its population was 16,921.[1] Its county seat is Snyder,[2] which is the home for Western Texas College. The county was created in 1876 and organized in 1884.[3] Scurry County was one of 46 prohibition, or entirely dry, counties in the state of Texas, until a 2006 election approved the sale of beer and wine in Snyder, and a 2008 election approved the sale of liquor by the drink throughout the county.
Scurry County comprises the Snyder, TX Micropolitan Statistical Area.
History
"This county, lying directly north of Mitchell County, was created in 1876, and was organized June 28, 1884. It was named for William Read Scurry, lawyer and Confederate Army general. Until 1909, it was without railroad facilities, and the nearest shipping points were Colorado City to the south and still later the railroad towns in Fisher County to the east.
The first railroad was the Roscoe, Snyder and Pacific Railway, built from Roscoe on the Texas & Pacific in Nolan County, to Snyder, the county seat of Scurry County, about 1909, and subsequently extended to Fluvanna, also in Scurry County. In 1911, the Texico-Coleman division of the Santa Fe system was built through the county, giving it a trunk line of railway. Development has been particularly rapid during the early 1900s.
Some of the important pioneer facts concerning Scurry County are found in a sketch of W.H. Snyder, after whom the county seat town was named. In 1877, he opened a trading camp in the county, hauling lumber on wagons from Dallas to build his store and also hauling a good portion of his goods from the same place. He used what was known as trail wagons, with seven yoke of oxen to a team, each wagon having a capacity of 50,000 pounds. Mr. Snyder erected a house in Scurry County and began dealing in general merchandise and supplies for buffalo hunters. Other parties moved into the same locality, and that was the beginning of the town of Snyder.
In 1882, Mr. Snyder laid out the town, and two years later, it became the county seat. Snyder has had an enterprising citizenship, and 10 years later had an independent school district and four churches, and was an important center for trade.
Its importance has greatly increased since the coming of the railway, and in 1910, its population was 2,154. Other towns have sprung up along the railway, the most important of which is Fluvanna, at the terminus of the Roscoe, Snyder & Pacific, and Hermleigh."[4]
Geography
According to the U.S. Census Bureau, the county has a total area of 908 square miles (2,350 km2), of which 905 square miles (2,340 km2) is land and 2.1 square miles (5.4 km2) (0.2%) is covered by water.[5]
Major highways
Adjacent counties
- Kent County (north)
- Fisher County (east)
- Mitchell County (south)
- Borden County (west)
- Garza County (northwest)
Demographics
| Census | Pop. | Note | %± |
|---|---|---|---|
| 1880 | 102 | — | |
| 1890 | 1,415 | 1,287.3% | |
| 1900 | 4,158 | 193.9% | |
| 1910 | 10,924 | 162.7% | |
| 1920 | 9,003 | −17.6% | |
| 1930 | 12,188 | 35.4% | |
| 1940 | 11,545 | −5.3% | |
| 1950 | 22,779 | 97.3% | |
| 1960 | 20,369 | −10.6% | |
| 1970 | 15,760 | −22.6% | |
| 1980 | 18,192 | 15.4% | |
| 1990 | 18,634 | 2.4% | |
| 2000 | 16,361 | −12.2% | |
| 2010 | 16,921 | 3.4% | |
| 2016 (est.) | 17,333 | [6] | 2.4% |
| U.S. Decennial Census[7] 1850–2010[8] 2010–2014[1] | |||
As of the census[9] of 2000, 16,361 people, 5,756 households, and 4,161 families resided in the county. The population density was 18 people per square mile (7/km²). The 7,112 housing units averaged 8 per square mile (3/km²). The racial makeup of the county was 81.27% White, 6.06% Black or African American, 0.53% Native American, 0.23% Asian, 10.51% from other races, and 1.41% from two or more races. About 27.77% of the population were Hispanic or Latino of any race.
Of the 5,756 households, 33.90% had children under the age of 18 living with them, 58.40% were married couples living together, 10.40% had a female householder with no husband present, and 27.70% were not families; 25.10% of all households were made up of individuals, and 12.90% had someone living alone who was 65 years of age or older. The average household size was 2.55 and the average family size was 3.05.
In the county, the population was distributed as 25.20% under the age of 18, 10.70% from 18 to 24, 26.20% from 25 to 44, 22.40% from 45 to 64, and 15.40% who were 65 years of age or older. The median age was 37 years. For every 100 females, there were 107.80 males. For every 100 females age 18 and over, there were 109.50 males.
The median income for a household in the county was $31,646, and for a family was $38,467. Males had a median income of $30,399 versus $18,061 for females. The per capita income for the county was $15,871. About 12.60% of families and 16.00% of the population were below the poverty line, including 21.60% of those under age 18 and 11.70% of those age 65 or over.
Communities
City
- Snyder (county seat)
Census-designated place
Unincorporated communities
Politics
| Year | Republican | Democratic | Third parties |
|---|---|---|---|
| 2016 | 83.0% 4,410 | 13.8% 733 | 3.2% 169 |
| 2012 | 82.0% 4,124 | 16.7% 838 | 1.3% 65 |
| 2008 | 79.3% 4,414 | 19.5% 1,088 | 1.2% 67 |
| 2004 | 82.1% 4,576 | 17.6% 981 | 0.3% 15 |
| 2000 | 76.2% 4,060 | 22.4% 1,193 | 1.4% 73 |
| 1996 | 50.0% 2,929 | 35.8% 2,099 | 14.3% 836 |
| 1992 | 43.6% 2,670 | 26.3% 1,609 | 30.1% 1,842 |
| 1988 | 63.6% 3,749 | 36.0% 2,119 | 0.4% 26 |
| 1984 | 75.9% 5,028 | 23.6% 1,564 | 0.6% 37 |
| 1980 | 64.1% 3,745 | 34.3% 2,003 | 1.7% 98 |
| 1976 | 51.2% 2,797 | 48.3% 2,639 | 0.4% 23 |
| 1972 | 74.8% 3,777 | 24.2% 1,223 | 1.0% 50 |
| 1968 | 35.9% 1,745 | 41.8% 2,031 | 22.3% 1,085 |
| 1964 | 33.9% 1,741 | 65.8% 3,381 | 0.3% 15 |
| 1960 | 42.3% 2,235 | 57.1% 3,020 | 0.7% 35 |
| 1956 | 45.5% 2,250 | 54.4% 2,691 | 0.2% 8 |
| 1952 | 51.4% 2,620 | 48.6% 2,480 | |
| 1948 | 8.7% 201 | 88.4% 2,040 | 2.9% 67 |
| 1944 | 13.1% 285 | 80.9% 1,761 | 6.0% 130 |
| 1940 | 10.8% 280 | 89.2% 2,303 | |
| 1936 | 8.5% 162 | 91.3% 1,746 | 0.2% 4 |
| 1932 | 6.1% 105 | 93.8% 1,604 | 0.1% 2 |
| 1928 | 77.5% 1,597 | 22.4% 462 | 0.1% 2 |
| 1924 | 16.7% 269 | 80.3% 1,292 | 3.0% 49 |
| 1920 | 15.0% 151 | 79.6% 801 | 5.4% 54 |
| 1916 | 3.6% 40 | 89.2% 994 | 7.3% 81 |
| 1912 | 3.8% 31 | 81.2% 661 | 15.0% 122 |
Gallery
-
 Veterans Monument at the Scurry County Courthouse
 -
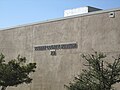 Scurry County Museum is located on the campus of Western Texas College in Snyder.
 -
 Scurry County Library in Snyder
 -
 West Texas State Bank in Snyder serves Scurry County.
 -
 Abandoned buildings, such as this one located off US Route 84 in northern Scurry County, are seen throughout the South Plains. This building was the Dermott Post Office located in Dermott, Scurry County, TX. It had an attached home for the postmaster.
 -
 Water tank in Scurry County, Texas, near Snyder, on north side of Hwy 84


See also
References
- ^ a b "State & County QuickFacts". United States Census Bureau. Retrieved December 24, 2013.
- ^ "Find a County". National Association of Counties. Retrieved 2011-06-07.
- ^ "Texas: Individual County Chronologies". Texas Atlas of Historical County Boundaries. The Newberry Library. 2008. Retrieved May 26, 2015.
- ^ Fehrenbach, T.R. "Lone Star: A History of Texas and the Texans" Da Capo Press, 2000.
- ^ "2010 Census Gazetteer Files". United States Census Bureau. August 22, 2012. Retrieved May 10, 2015.
- ^ "Population and Housing Unit Estimates". Retrieved June 9, 2017.
- ^ "U.S. Decennial Census". United States Census Bureau. Retrieved May 10, 2015.
- ^ "Texas Almanac: Population History of Counties from 1850–2010" (PDF). Texas Almanac. Retrieved May 10, 2015.
- ^ "American FactFinder". United States Census Bureau. Retrieved 2011-05-14.
- ^ Leip, David. "Dave Leip's Atlas of U.S. Presidential Elections". uselectionatlas.org. Retrieved 2018-07-30.
External links
- Scurry County government's website
- Scurry County from the Handbook of Texas Online
- Historic Scurry County materials, hosted by the Portal to Texas History.
- TXGenWeb Scurry County website
- Scurry County Genealogy Trails[permanent dead link]
- Scurry County Profile from the Texas Association of Counties
Places adjacent to Scurry County, Texas | ||||||||||||||||
|---|---|---|---|---|---|---|---|---|---|---|---|---|---|---|---|---|
| ||||||||||||||||
Municipalities and communities of Scurry County, Texas, United States | ||
|---|---|---|
| City |  | |
| CDPs | ||
| Other communities | ||