
1920 United States presidential election
| |||||||||||||||||||||||||||||
531 electoral votes of the Electoral College 266 electoral votes needed to win | |||||||||||||||||||||||||||||
|---|---|---|---|---|---|---|---|---|---|---|---|---|---|---|---|---|---|---|---|---|---|---|---|---|---|---|---|---|---|
| Turnout | 49.2%[1] | ||||||||||||||||||||||||||||
| |||||||||||||||||||||||||||||
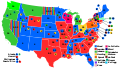
 Presidential election results map. Red denotes states won by Harding/Coolidge, blue denotes those won by Cox/Roosevelt. Numbers indicate the number of electoral votes allotted to each state. | |||||||||||||||||||||||||||||
| |||||||||||||||||||||||||||||


The United States presidential election of 1920 was the 34th quadrennial presidential election, held on Tuesday, November 2, 1920. The Republicans nominated newspaper publisher and Ohio Senator Warren G. Harding, while the Democrats chose newspaper publisher and Ohio Governor James M. Cox. Incumbent President Woodrow Wilson, a Democrat, in poor health, chose not to run for a third term. Former President Theodore Roosevelt had been the front runner for the Republican nomination, but his health collapsed in 1918. He died in January 1919 without leaving an obvious heir to his progressive legacy. With both Wilson and Roosevelt out of the running, the major parties turned to little-known dark horse candidates from state of Ohio, one of the states with the largest number of electoral votes. As his running mate, Cox chose Franklin D. Roosevelt, a fifth cousin of Theodore Roosevelt who would be elected president himself in 1932.
Harding virtually ignored Cox in the race and essentially campaigned against Wilson by calling for a return to "normalcy." With a spending advantage of almost 4-to-1, Harding won a landslide victory by winning 37 states, including the first Republican victories in Arizona, New Mexico and Oklahoma (then the three states most recently admitted to the Union).
The election was dominated by the American social and political environment in the aftermath of World War I, which was marked by a hostile response to certain aspects of Wilson's foreign policy and a massive reaction against the reformist zeal of the Progressive Era. The wartime economic boom had collapsed. Wilson's advocacy for America's entry into the League of Nations in the face of a return to non-interventionist opinion challenged his effectiveness as president and overseas, there were wars and revolutions. At home, the year 1919 was marked by major strikes in the meatpacking and steel industries and large-scale race riots in Chicago and other cities. Anarchist attacks on Wall Street produced fears of radicals and terrorists. The Irish Catholic and German communities were outraged at Wilson's perceived favoritism of their traditional enemy Great Britain, and his political position was critically weakened after he suffered a severe stroke in 1919 that left him severely disabled.
Harding's victory margin of 26.2% in the popular vote (60.3% to 34.1%) remains the largest popular-vote percentage margin in presidential elections after the unopposed election of James Monroe in 1820. Harding's percentage of the popular vote, however, was later exceeded by Franklin Roosevelt in 1936, Lyndon Johnson in 1964, and Richard Nixon in 1972.
This election was the first since the ratification of the Nineteenth Amendment to the United States Constitution on August 18, 1920, and thus the first in which women had the right to vote in all 48 states (in the 1916 presidential election, about 30 states had permitted women to participate). As a result, the total popular vote increased dramatically, from 18.5 million in 1916 to 26.8 million in 1920.[2] The election is also notable for being the first of three in which a sitting U.S. senator was elected president (the others were 1960 and 2008).
Nominations
Republican Party nomination
Republican candidates:


On June 8, the Republican National Convention met in Chicago. The race was wide open, and soon the convention deadlocked between Major General Leonard Wood and Governor Frank Orren Lowden of Illinois.
Other names placed in nomination included Senators Warren G. Harding from Ohio, Hiram Johnson from California, and Miles Poindexter from Washington, Governor Calvin Coolidge of Massachusetts, philanthropist Herbert Hoover, and Columbia University President Nicholas M. Butler. Senator Robert M. La Follette from Wisconsin was not formally placed in nomination, but received the votes of his state delegation nonetheless. Harding was nominated for president on the tenth ballot, after some delegates shifted their allegiances. The results of the ten ballots were as follows:
| Presidential Balloting, Republican National Convention 1920 | |||||||||||
|---|---|---|---|---|---|---|---|---|---|---|---|
| Ballot | 1 | 2 | 3 | 4 | 5 | 6 | 7 | 8 | 9 | 10 Before shifts |
10 After shifts |
| Warren G. Harding | 65.5 | 59.0 | 58.5 | 61.5 | 78.0 | 89.0 | 105.0 | 133.0 | 374.5 | 644.7 | 692.2 |
| Leonard Wood | 287.5 | 289.5 | 303.0 | 314.5 | 299.0 | 311.5 | 312.0 | 299.0 | 249.0 | 181.5 | 156.0 |
| Frank Orren Lowden | 211.5 | 259.5 | 282.5 | 289.0 | 303.0 | 311.5 | 311.5 | 307.0 | 121.5 | 28.0 | 11.0 |
| Hiram Johnson | 133.5 | 146.0 | 148.0 | 140.5 | 133.5 | 110.0 | 99.5 | 87.0 | 82.0 | 80.8 | 80.8 |
| William Cameron Sproul | 84.0 | 78.5 | 79.5 | 79.5 | 82.5 | 77.0 | 76.0 | 76.0 | 78.0 | 0 | 0 |
| Nicholas Murray Butler | 69.5 | 41.0 | 25.0 | 20.0 | 4.0 | 4.0 | 2.0 | 2.0 | 2.0 | 2.0 | 2.0 |
| Calvin Coolidge | 34.0 | 32.0 | 27.0 | 25.0 | 29.0 | 28.0 | 28.0 | 30.0 | 28.0 | 5.0 | 5.0 |
| Robert M. La Follette | 24.0 | 24.0 | 24.0 | 22.0 | 24.0 | 24.0 | 24.0 | 24.0 | 24.0 | 24.0 | 24.0 |
| Jeter Connelly Pritchard | 21.0 | 10.0 | 0 | 0 | 0 | 0 | 0 | 0 | 0 | 0 | 0 |
| Miles Poindexter | 20.0 | 15.0 | 15.0 | 15.0 | 15.0 | 15.0 | 15.0 | 15.0 | 14.0 | 2.0 | 0 |
| Howard Sutherland | 17.0 | 15.0 | 9.0 | 3.0 | 1.0 | 0 | 0 | 0 | 0 | 0 | 0 |
| Herbert Hoover | 5.5 | 5.5 | 5.5 | 5.0 | 6.0 | 5.0 | 4.0 | 5.0 | 6.0 | 10.5 | 9.5 |
| Scattering | 11.0 | 9.0 | 7.0 | 9.0 | 9.0 | 9.0 | 6.0 | 6.0 | 5.0 | 5.5 | 3.5 |
-
 First Presidential Ballot
 -
 Second Presidential Ballot
 -
 Third Presidential Ballot
 -
 Fourth Presidential Ballot
 -
 Fifth Presidential Ballot
 -
 Sixth Presidential Ballot
 -
 Seventh Presidential Ballot
 -
 Eighth Presidential Ballot
 -
 Ninth Presidential Ballot
 -
 Tenth Presidential Ballot
Before Shifts -
 Tenth Presidential Ballot
After Shifts


Harding's nomination, said to have been secured in negotiations among party bosses in a "smoke-filled room," was engineered by Harry M. Daugherty, Harding's political manager, who became United States Attorney General after his election. Prior to the convention, Daugherty was quoted as saying, "I don't expect Senator Harding to be nominated on the first, second, or third ballots, but I think we can afford to take chances that about 11 minutes after two, Friday morning of the convention, when 15 or 12 weary men are sitting around a table, someone will say: 'Who will we nominate?' At that decisive time, the friends of Harding will suggest him and we can well afford to abide by the result." Daugherty's prediction described essentially what occurred, but historians Richard C. Bain and Judith H. Parris argue that Daugherty's prediction has been given too much weight in narratives of the convention.
Once the presidential nomination was finally settled, the party bosses and Sen. Harding recommended Wisconsin Sen. Irvine Lenroot to the delegates for the second spot, but the delegates revolted and nominated Coolidge, who was very popular over his handling of the Boston Police Strike from the year before. The Tally:
| Vice Presidential Balloting, Republican Nat'l Convention 1920 | |
|---|---|
| Calvin Coolidge | 674.5 |
| Irvine Lenroot | 146.5 |
| Henry Justin Allen | 68.5 |
| Henry W. Anderson | 28 |
| Asle Gronna | 24 |
| Hiram Johnson | 22.5 |
| Jeter Connelly Pritchard | 11 |
| Abstaining | 9 |
Source for convention coverage: Richard C. Bain and Judith H. Parris, Convention Decisions and Voting Records (Washington DC: Brookings Institution, 1973), pp. 200–208.
Democratic Party nomination
Democratic candidates:


It was widely accepted prior to the election that President Woodrow Wilson would not run for a third term, and would certainly not be nominated if he did make an attempt to regain the nomination. While Vice-President Thomas R. Marshall had long held a desire to succeed Wilson, his indecisive handling of the situation around Wilson's illness and incapacity destroyed any credibility he had as a candidate, and in the end he did not formally put himself forward for the nomination.
Although William Gibbs McAdoo (Wilson's son-in-law and former Treasury Secretary) was the strongest candidate, Wilson blocked his nomination in hopes a deadlocked convention would demand that he run for a third term, even though he was seriously ill, physically immobile, and in seclusion at the time. The Democrats, meeting in San Francisco between June 28 and July 6 (the first time a major party held its nominating convention in an urban center on the Pacific coast), nominated another newspaper editor from Ohio, Governor James M. Cox, as their presidential candidate, and 38-year-old Assistant Secretary of the Navy Franklin D. Roosevelt, a fifth cousin of the late president Theodore Roosevelt, for vice-president.
Early favorites for the nomination had included McAdoo and Attorney General Alexander Mitchell Palmer. Others placed in nomination included New York Governor Al Smith, United Kingdom Ambassador John W. Davis, New Jersey Governor Edward I. Edwards, and Oklahoma Senator Robert Latham Owen.
| (1-22) | Presidential Ballot | ||||||||||||||||||||||||
|---|---|---|---|---|---|---|---|---|---|---|---|---|---|---|---|---|---|---|---|---|---|---|---|---|---|
| 1st | 2nd | 3rd | 4th | 5th | 6th | 7th | 8th | 9th | 10th | 11th | 12th | 13th | 14th | 15th | 16th | 17th | 18th | 19th | 20th | 21st | 22nd | ||||
| James M. Cox | 134 | 159 | 177 | 178 | 181 | 195 | 295.5 | 315 | 321.5 | 321 | 332 | 404 | 428.5 | 443.5 | 468.5 | 454.5 | 442 | 458 | 468 | 456.5 | 426.5 | 430 | |||
| William Gibbs McAdoo | 266 | 289 | 323.5 | 335 | 357 | 368.5 | 384 | 380 | 386 | 285 | 380 | 375.5 | 363.5 | 355.5 | 344.5 | 337 | 332 | 330.5 | 327.5 | 340.5 | 395.5 | 372.5 | |||
| A. Mitchell Palmer | 256 | 264 | 251.5 | 254 | 244 | 265 | 267 | 262 | 257 | 257 | 255 | 201 | 193.5 | 181 | 167 | 164.5 | 176 | 174.5 | 179.5 | 178 | 144 | 166.5 | |||
| Alfred E. Smith | 109 | 101 | 92 | 96 | 95 | 98 | 4 | 2 | 1 | 0 | 0 | 0 | 0 | 0 | 0 | 0 | 0 | 0 | 0 | 0 | 0 | 0 | |||
| Edward I. Edwards | 42 | 34 | 32.5 | 31 | 31 | 30 | 2 | 0 | 0 | 0 | 0 | 0 | 0 | 0 | 0 | 0 | 0 | 0 | 0 | 0 | 0 | 0 | |||
| Thomas R. Marshall | 37 | 36 | 36 | 34 | 29 | 13 | 14 | 12 | 7 | 7 | 7 | 7 | 7 | 7 | 0 | 0 | 0 | 0 | 0 | 0 | 0 | 0 | |||
| Robert L. Owen | 33 | 29 | 22 | 32 | 34 | 36 | 35 | 36 | 37 | 37 | 35 | 34 | 32 | 34 | 31 | 34 | 36 | 38 | 37 | 41 | 36 | 35 | |||
| John W. Davis | 32 | 31.5 | 28.5 | 31 | 29 | 29 | 33 | 32 | 32 | 34 | 33 | 31.5 | 29.5 | 33 | 32 | 52 | 57 | 42 | 31 | 36 | 54 | 52 | |||
| Edwin T. Meredith | 27 | 26 | 26 | 28 | 27 | 0 | 0 | 0 | 0 | 0 | 0 | 0 | 0 | 0 | 0 | 0 | 0 | 0 | 0 | 0 | 0 | 0 | |||
| Carter Glass | 26.5 | 25.5 | 27 | 27 | 27 | 27 | 27 | 27 | 25 | 25 | 25 | 25 | 25 | 25 | 25 | 25 | 27 | 26 | 26 | 26 | 26 | 25 | |||
| Homer Cummings | 25 | 27 | 26 | 24 | 21 | 20 | 19 | 18 | 18 | 19 | 19 | 8 | 7 | 7 | 19 | 20 | 19 | 19 | 19 | 10 | 7 | 6 | |||
| Furnifold M. Simmons | 24 | 25 | 0 | 0 | 0 | 0 | 0 | 0 | 0 | 0 | 0 | 0 | 0 | 0 | 0 | 0 | 0 | 0 | 0 | 0 | 0 | 0 | |||
| James W. Gerard | 21 | 12 | 11 | 2 | 0 | 0 | 0 | 1 | 1 | 2 | 1 | 1 | 0 | 0 | 0 | 0 | 0 | 0 | 1 | 1 | 0 | 0 | |||
| John Sharp Williams | 20 | 0 | 0 | 0 | 0 | 0 | 0 | 0 | 0 | 0 | 0 | 0 | 0 | 0 | 0 | 0 | 0 | 0 | 0 | 0 | 0 | 0 | |||
| Gilbert M. Hitchcock | 18 | 16 | 16 | 5 | 5 | 0 | 0 | 0 | 0 | 0 | 0 | 0 | 0 | 0 | 0 | 0 | 0 | 0 | 0 | 0 | 0 | 0 | |||
| Champ Clark | 9 | 6 | 7 | 8 | 9 | 7 | 8 | 6 | 5 | 4 | 4 | 4 | 4 | 4 | 4 | 4 | 2 | 2 | 2 | 2 | 2 | 2 | |||
| Pat Harrison | 6 | 0 | 6 | 0 | 0 | 0 | 0 | 0 | 0 | 0 | 0 | 0 | 0 | 0 | 0 | 0 | 0 | 0 | 0 | 0 | 0 | 0 | |||
| Leonard Wood | 4 | 0 | 0 | 0 | 0 | 0 | 0 | 0 | 0 | 0 | 0 | 0 | 0 | 0 | 0 | 0 | 0 | 0 | 0 | 0 | 0 | 0 | |||
| William Jennings Bryan | 1 | 1 | 0 | 1 | 0 | 0 | 0 | 0 | 0 | 0 | 0 | 0 | 0 | 0 | 0 | 0 | 0 | 0 | 0 | 0 | 0 | 0 | |||
| Bainbridge Colby | 1 | 0 | 0 | 0 | 2 | 1 | 0 | 0 | 0 | 0 | 0 | 0 | 0 | 0 | 0 | 0 | 0 | 0 | 0 | 0 | 0 | 0 | |||
| Josephus Daniels | 1 | 1 | 1 | 0 | 0 | 0 | 0 | 0 | 0 | 0 | 0 | 0 | 0 | 0 | 0 | 0 | 0 | 0 | 0 | 0 | 0 | 0 | |||
| William Randolph Hearst | 1 | 0 | 0 | 0 | 0 | 0 | 0 | 0 | 0 | 0 | 0 | 0 | 0 | 0 | 0 | 0 | 0 | 0 | 0 | 0 | 0 | 0 | |||
| Oscar Underwood | 0.5 | 0 | 0 | 0 | 0 | 0 | 0 | 0 | 0 | 0 | 0 | 0 | 0 | 0 | 0 | 0 | 0 | 0 | 0 | 0 | 0 | 0 | |||
| Woodrow Wilson | 0 | 0 | 0 | 0 | 0 | 0 | 0 | 0 | 0 | 0 | 0 | 0 | 0 | 0 | 0 | 0 | 0 | 0 | 0 | 0 | 0 | 2 | |||
| (23-44) | Presidential Ballot | ||||||||||||||||||||||||
|---|---|---|---|---|---|---|---|---|---|---|---|---|---|---|---|---|---|---|---|---|---|---|---|---|---|
| 23rd | 24th | 25th | 26th | 27th | 28th | 29th | 30th | 31st | 32nd | 33rd | 34th | 35th | 36th | 37th | 38th | 39th | 40th | 41st | 42nd | 43rd | 44th | ||||
| James M. Cox | 425 | 429 | 424 | 424.5 | 423.5 | 423 | 404.5 | 400.5 | 391.5 | 391 | 380.5 | 379.5 | 376.5 | 377 | 386 | 383.5 | 468.5 | 490 | 497.5 | 540.5 | 568 | 699.5 | |||
| William Gibbs McAdoo | 364.5 | 364.5 | 364.5 | 371 | 371.5 | 368.5 | 394.5 | 403.5 | 415.5 | 421 | 421 | 420.5 | 409 | 399 | 405 | 405.5 | 440 | 467 | 460 | 427 | 412 | 270 | |||
| A. Mitchell Palmer | 181.5 | 177 | 169 | 167 | 166.5 | 165.5 | 166 | 165 | 174 | 176 | 180 | 184 | 222 | 241 | 202.5 | 211 | 74 | 19 | 12 | 8 | 7 | 1 | |||
| John W. Davis | 50.5 | 54.5 | 58.5 | 55.5 | 60.5 | 62.5 | 63 | 58 | 57.5 | 55.5 | 56 | 54 | 33 | 28 | 50.5 | 50 | 71.5 | 76 | 55.5 | 49.5 | 57.5 | 52 | |||
| Robert L. Owen | 34 | 33 | 34 | 33 | 34 | 35.5 | 33 | 33 | 34 | 34 | 34 | 37 | 38.5 | 36 | 33 | 33 | 32 | 33 | 35 | 34 | 34 | 34 | |||
| Carter Glass | 25 | 25 | 25 | 25 | 25 | 24 | 24 | 24 | 12.5 | 9.5 | 13 | 7.5 | 5 | 4 | 1 | 1 | 0 | 0 | 24 | 24 | 5.5 | 1.5 | |||
| Homer Cummings | 5 | 5 | 4 | 3 | 3 | 4 | 4 | 4 | 3 | 3 | 3 | 3 | 3 | 3 | 3 | 4 | 2 | 2 | 2 | 3 | 2 | 0 | |||
| Champ Clark | 2 | 2 | 2 | 3 | 2 | 2 | 2 | 2 | 2 | 2 | 2.5 | 2.5 | 2 | 2 | 2 | 3 | 2 | 2 | 2 | 2 | 2 | 0 | |||
| Annette Abbott Adams | 0 | 0 | 0 | 0 | 0 | 0 | 0 | 0 | 0 | 0 | 0 | 0 | 0 | 0 | 1 | 0 | 0 | 0 | 0 | 0 | 0 | 0 | |||
| Eugene C. Bonniwell | 0 | 0 | 0 | 1 | 0 | 0 | 0 | 0 | 0 | 0 | 0 | 0 | 0 | 0 | 1 | 0 | 0 | 0 | 0 | 0 | 0 | 0 | |||
| William Jennings Bryan | 0 | 0 | 0 | 1 | 0 | 0 | 0 | 0 | 0 | 0 | 0 | 0 | 0 | 0 | 0 | 0 | 0 | 0 | 0 | 0 | 0 | 0 | |||
| Laura Clay | 0 | 0 | 0 | 0 | 0 | 0 | 0 | 0 | 0 | 0 | 1 | 0 | 0 | 0 | 0 | 0 | 0 | 0 | 0 | 0 | 0 | 0 | |||
| Irvin S. Cobb | 1.5 | 0 | 0 | 0 | 0 | 0 | 0 | 0 | 0 | 0 | 0 | 0 | 0 | 0 | 0 | 0 | 0 | 0 | 0 | 0 | 0 | 0 | |||
| Bainbridge Colby | 0 | 0 | 0 | 0 | 0 | 0 | 0 | 0 | 0 | 0 | 0 | 0 | 0 | 0 | 0 | 0 | 1 | 1 | 1 | 1 | 1 | 1 | |||
| Josephus Daniels | 0 | 0 | 0 | 0 | 0 | 0 | 0 | 0 | 1 | 0 | 0 | 0 | 0 | 0 | 0 | 0 | 0 | 0 | 0 | 0 | 0 | 0 | |||
| Walker Hines | 0 | 0 | 0 | 0 | 0 | 1 | 0 | 0 | 0 | 0 | 0 | 0 | 0 | 0 | 0 | 0 | 0 | 0 | 0 | 0 | 0 | 0 | |||
| Andrieus A. Jones | 0 | 0 | 0 | 1 | 0 | 0 | 0 | 0 | 0 | 0 | 0 | 0 | 0 | 0 | 0 | 0 | 0 | 0 | 0 | 0 | 0 | 0 | |||
| Ring Lardner | 0.5 | 0 | 0 | 0 | 0 | 0 | 0 | 0 | 0 | 0 | 0 | 0 | 0 | 0 | 0 | 0 | 0 | 0 | 0 | 0 | 0 | 0 | |||
| James H. Lewis | 0 | 0 | 0 | 1 | 0 | 0 | 0 | 0 | 0 | 0 | 0 | 0 | 0 | 0 | 6 | 0 | 0 | 0 | 0 | 0 | 0 | 0 | |||
| Thomas R. Marshall | 0 | 0 | 0 | 0 | 1 | 0 | 0 | 0 | 1 | 0 | 0 | 0 | 0 | 0 | 0 | 0 | 0 | 0 | 0 | 0 | 0 | 0 | |||
| John J. Pershing | 0 | 0 | 1 | 0 | 0 | 0 | 0 | 0 | 0 | 0 | 0 | 0 | 0 | 0 | 0 | 0 | 0 | 0 | 0 | 0 | 0 | 0 | |||
| Joseph T. Robinson | 0 | 0 | 0 | 0 | 1 | 0 | 0 | 0 | 0 | 0 | 0 | 0 | 0 | 0 | 0 | 0 | 0 | 0 | 0 | 0 | 0 | 0 | |||
| Cora Wilson Stewart | 0 | 0 | 0 | 0 | 0 | 0 | 0 | 0 | 0 | 0 | 0 | 0 | 0 | 1 | 0 | 0 | 0 | 0 | 0 | 0 | 0 | 0 | |||
| Oscar Underwood | 0 | 1 | 9 | 9 | 4 | 6 | 1 | 2 | 0 | 0 | 0 | 0 | 0 | 0 | 0 | 0 | 0 | 0 | 0 | 0 | 0 | 0 | |||
General election
Return to normalcy
Warren Harding's main campaign slogan was a "return to normalcy", playing upon the weariness of the American public after the social upheaval of the Progressive Era. Additionally, the international responsibilities engendered by the American victory in World War I and the Treaty of Versailles proved deeply unpopular, causing a reaction against Wilson, who had pushed especially hard for the latter.
Ethnic issues

Irish Americans were powerful in the Democratic party, and groups such as Clan na Gael opposed going to war alongside their enemy Britain, especially after the violent suppression of the Easter Rising of 1916. Wilson won them over in 1917 by promising to ask Britain to give Ireland its independence. Wilson had won the presidential election of 1916 with strong support from German-Americans and Irish-Americans, largely because of his slogan "He kept us out of war" and the longstanding American policy of isolationism. At the Paris Peace Conference in 1919, however, he reneged on his commitments to the Irish-American community, and it vehemently denounced him. His dilemma was that Britain was his war ally. Events such as the anti-British Black Tom and Kingsland Explosions in 1916 on American soil (in part the result of wartime Irish and German co-ordination) and the Irish anti-conscription crisis of 1918 were all embarrassing to recall in 1920.[3][4]
Britain had already passed an Irish Home Rule Act in 1914, suspended for the war's duration. However the 1916 Easter Rising in Dublin had led to increased support for the more radical Sinn Féin who in 1919 formed the First Dáil, effectively declaring Ireland independent, sparking the Irish War of Independence. Britain was to pass the Government of Ireland Act in late 1920, by which Ireland would have 2 home-ruled states within the British empire. This satisfied Wilson. The provisions of these were inadequate to the supporters of the Irish Republic, however, which claimed full sovereignty. This position was also supported by many Irish Americans. The American Committee for Relief in Ireland was set up in 1920 to assist victims of the Irish War of Independence of 1919–21. Some Irish-American Senators joined the "irreconcilables" who blocked the ratification of the Treaty of Versailles and United States membership in the League of Nations.
Wilson blamed the Irish Americans and German Americans for the lack of popular support for his unsuccessful campaign to have the United States join the League of Nations, saying, "There is an organized propaganda against the League of Nations and against the treaty proceeding from exactly the same sources that the organized propaganda proceeded from which threatened this country here and there with disloyalty, and I want to say—I cannot say too often—any man who carries a hyphen about with him [i.e., a hyphenated American] carries a dagger that he is ready to plunge into the vitals of this Republic whenever he gets ready."[5]
Of the $5,500,000 raised by supporters of the Irish Republic in the United States in 1919–20, the Dublin parliament (Dáil Éireann) voted in June 1920 to spend $500,000 on the American presidential election.[6] How this money was spent remains unclear. Ironically, the lawyer who had advised the fundraisers was Franklin D. Roosevelt, the losing vice-presidential candidate. In any case, the Irish American city machines sat on their hands during the election, allowing the Republicans to roll up unprecedented landslides in every major city. Many German-American Democrats voted Republican or stayed home, giving the GOP landslides in the rural Midwest.
Campaign

Wilson had hoped for a "solemn referendum" on the League of Nations, but did not get one. Harding waffled on the League, thereby keeping Idaho Senator William Borah and other Republican "irreconcilables" in line. Cox also hedged. He went to the White House to seek Wilson's blessing and apparently endorsed the League, but—upon discovering its unpopularity among Democrats—revised his position to one that would accept the League only with reservations, particularly on Article Ten, which would require the United States to participate in any war declared by the League (thus taking the same standpoint as Republican Senate leader Henry Cabot Lodge). As reporter Brand Whitlock observed, the League was an issue important in government circles, but rather less so to the electorate. He also noted that the campaign was not being waged on issues: "The people, indeed, do not know what ideas Harding or Cox represents; neither do Harding or Cox. Great is democracy."[7] False rumors circulated that Senator Harding had "Negro blood," but this did not greatly hurt Harding's election campaign.
Governor Cox made a whirlwind campaign that took him to rallies, train station speeches, and formal addresses, reaching audiences totaling perhaps two million, whereas Senator Harding relied upon a "Front Porch Campaign" similar to that of William McKinley in 1896. It brought thousands of voters to Marion, Ohio, where Harding spoke from his home. GOP campaign manager Will Hays spent some $8.1 million, nearly four times the money Cox's campaign spent. Hays used national advertising in a major way (with advice from adman Albert Lasker). The theme was Harding's own slogan "America First." Thus the Republican advertisement in Collier's Magazine for October 30, 1920, demanded, "Let's be done with wiggle and wobble." The image presented in the ads was nationalistic, using catch phrases like "absolute control of the United States by the United States," "Independence means independence, now as in 1776," "This country will remain American. Its next President will remain in our own country," and "We decided long ago that we objected to foreign government of our people."[8]
On election night, November 2, 1920, commercial radio broadcast coverage of election returns for the first time. Announcers at KDKA-AM in Pittsburgh read telegraph ticker results over the air as they came in. This single station could be heard over most of the Eastern United States by the small percentage of the population that had radio receivers.
Harding's landslide came from all directions except the South. Irish- and German-American voters who had backed Wilson and peace in 1916 now voted against Wilson and Versailles. "A vote for Harding", said the German-language press, "is a vote against the persecutions suffered by German-Americans during the war." Not one major German-language newspaper supported Governor Cox.[9] Many Irish Americans, bitterly angry at Wilson's refusal to help Ireland at Versailles, simply abstained from voting in the presidential election. This allowed the Republicans to mobilize the ethnic vote, and Harding swept the big cities.

This was the first election in which women from every state were allowed to vote, following the passage of the 19th Amendment to the Constitution in August 1920 (just in time for the general election).
Tennessee's vote for Warren G. Harding marked the first time since the end of Reconstruction that even one of the 11 states of the former Confederacy had voted for a Republican presidential candidate. Tennessee had last been carried by a Republican when Ulysses S. Grant claimed it in 1868.
Despite the fact that Cox was defeated badly, his running mate Franklin D. Roosevelt became a well-known political figure because of his active and energetic campaign. In 1928 he was elected Governor of New York, and in 1932 he was elected president. He remained in power until his death in 1945 as the longest-serving American president in history.
Other candidates
Socialist Party candidate Eugene V. Debs received 913,664 popular votes (3.4%), despite the fact that he was in prison at the time for advocating non-compliance with the draft during World War I. This was the largest number of popular votes ever received by a Socialist Party candidate in the United States, although not the largest percentage of the popular vote. Debs received double this percentage in the election of 1912.[10] The 1920 election was his fifth and last attempt to become president.
Parley P. Christensen of the Farmer-Labor Party took 265,411 votes (1.0%), while Prohibition Party candidate Aaron S. Watkins came in fifth with 189,339 votes (0.7%), the poorest showing for the Prohibition party since 1884. Since the Eighteenth Amendment, which initiated the period of Prohibition in the United States, had passed the previous year, this single-issue party seemed less relevant.
Results

The total vote for 1920 was roughly 26,750,000, an increase of 8,000,000 from 1916.[12] The Democratic vote was almost exactly the vote from 1916, but the Republican vote nearly doubled, as did the "other" vote. As pointed out earlier, the great increase in the total number of votes is mainly attributable to the passage of the Nineteenth Amendment to the United States Constitution.
Nearly two-thirds of the counties (1,949) were carried by the Republicans. The Democrats carried only 1,101 counties, a smaller number than Alton Parker had carried in 1904 and consequently the smallest number during the Fourth Party System. Not a single county was carried in the Pacific section by the Democrats, and only 13 in the Mountain section, where there had been 223 in the previous election. There was a loss in every section in the Union and a loss in every state except South Carolina and Mississippi. Eleven counties in Texas recorded more votes cast for "Other(s)" than either of the two-party candidates.
The distribution of the county vote accurately represents the overwhelming character of the majority vote. Harding had 60.35% of the total vote, the largest percentage in the Fourth Party System, exceeding Franklin D. Roosevelt's in 1932.
Although the Democratic portion was 34.13%, in no section did its voting share sink below 24%, and in three sections, it topped the poll. The Democratic Party was obviously still an opposition force on national terms, even though Cox won only 11 states and had fewer votes in the electoral college than Parker had won in 1904. More than two-thirds of the Cox vote was in states carried by Harding.
The distribution of the vote by counties, and the study of percentages in sections, states, and counties, seem to show that it was Wilson and foreign policies that received the brunt of attack, not the Democratic Party and the domestic proposals of the period 1896–1914.[13]
| Presidential candidate | Party | Home state | Popular vote | Electoral vote |
Running mate | |||
|---|---|---|---|---|---|---|---|---|
| Count | Percentage | Vice-presidential candidate | Home state | Electoral vote | ||||
| Warren G. Harding | Republican | Ohio | 16,144,093 | 60.32% | 404 | Calvin Coolidge | Massachusetts | 404 |
| James M. Cox | Democratic | Ohio | 9,139,661 | 34.15% | 127 | Franklin D. Roosevelt | New York | 127 |
| Eugene V. Debs | Socialist | Indiana | 913,693 | 3.41% | 0 | Seymour Stedman | Illinois | 0 |
| Parley P. Christensen | Farmer-Labor | Illinois | 265,398 | 0.99% | 0 | Max S. Hayes | Ohio | 0 |
| Aaron S. Watkins | Prohibition | Indiana | 188,787 | 0.71% | 0 | D. Leigh Colvin | New York | 0 |
| James E. Ferguson | American | Texas | 47,968 | 0.18% | 0 | William J. Hough | New York | 0 |
| William Wesley Cox | Socialist Labor | Missouri | 31,084 | 0.12% | 0 | August Gillhaus | New York | 0 |
| Robert Colvin Macauley | Single Tax | Pennsylvania | 5,750 | 0.02% | 0 | Richard C. Barnum | Ohio | 0 |
| Other | 28,746 | 0.11% | — | Other | — | |||
| Total | 26,765,180 | 100% | 531 | 531 | ||||
| Needed to win | 266 | 266 | ||||||
Source (Popular Vote): Leip, David. "1920 Presidential Election Results". Dave Leip's Atlas of U.S. Presidential Elections. Retrieved September 11, 2012.
Source (Electoral Vote): "Electoral College Box Scores 1789–1996". National Archives and Records Administration. Retrieved July 31, 2005.
Geography of Results

-
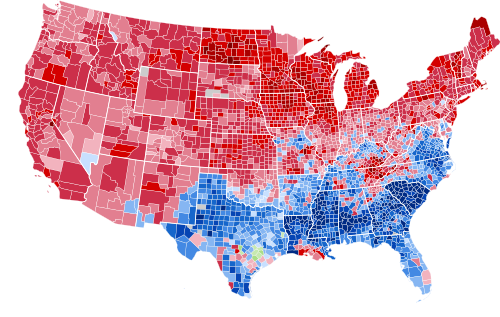 Results by county, shaded according to winning candidate's percentage of the vote

Cartographic Gallery
-
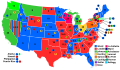
 Map of presidential election results by county.
 -
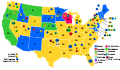
 Map of Republican presidential election results by county.
 -
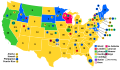
 Map of Democratic presidential election results by county.
 -
 Map of "other" presidential election results by county.
 -
 Cartogram of presidential election results by county.
 -
 Cartogram of Republican presidential election results by county.
 -
 Cartogram of Democratic presidential election results by county.
 -
 Cartogram of "other" presidential election results by county.


Results by state
| States won by Harding/Coolidge |
| States won by Cox/Roosevelt |
| Warren G. Harding Republican |
James Cox Democratic |
Eugene Debs Socialist |
Parley Christensen Farmer-Labor |
Aaron Watkins Prohibition |
James Ferguson American |
William Cox Socialist Labor |
Margin | State Total | ||||||||||||||||||
|---|---|---|---|---|---|---|---|---|---|---|---|---|---|---|---|---|---|---|---|---|---|---|---|---|---|---|
| State | electoral votes |
# | % | electoral votes |
# | % | electoral votes |
# | % | electoral votes |
# | % | electoral votes |
# | % | electoral votes |
# | % | electoral votes |
# | % | electoral votes |
# | % | # | |
| Alabama | 12 | 74,556 | 31.37 | - | 159,965 | 67.31 | 12 | 2,369 | 1.00 | - | - | - | - | 748 | 0.31 | - | - | - | - | - | - | - | -85,409 | -35.94 | 237,638 | AL |
| Arizona | 3 | 37,016 | 55.61 | 3 | 29,546 | 44.39 | - | - | - | - | - | - | - | - | - | - | - | - | - | - | - | - | 7,470 | 11.22 | 66,562 | AZ |
| Arkansas | 9 | 71,117 | 38.73 | - | 107,409 | 58.49 | 9 | 5,111 | 2.78 | - | - | - | - | - | - | - | - | - | - | - | - | - | -36,292 | -19.76 | 183,637 | AR |
| California | 13 | 624,992 | 66.20 | 13 | 229,191 | 24.28 | - | 64,076 | 6.79 | - | - | - | - | 25,204 | 2.67 | - | - | - | - | - | - | - | 395,801 | 41.93 | 944,050 | CA |
| Colorado | 6 | 173,248 | 59.32 | 6 | 104,936 | 35.93 | - | 8,046 | 2.75 | - | 3,016 | 1.03 | - | 2,807 | 0.96 | - | - | - | - | - | - | - | 68,312 | 23.39 | 292,053 | CO |
| Connecticut | 7 | 229,238 | 62.72 | 7 | 120,721 | 33.03 | - | 10,350 | 2.83 | - | 1,947 | 0.53 | - | 1,771 | 0.48 | - | - | - | - | 1,491 | 0.41 | - | 108,517 | 29.69 | 365,518 | CT |
| Delaware | 3 | 52,858 | 55.71 | 3 | 39,911 | 42.07 | - | 988 | 1.04 | - | 93 | 0.10 | - | 986 | 1.04 | - | - | - | - | - | - | - | 12,947 | 13.65 | 94,875 | DE |
| Florida | 6 | 44,853 | 30.79 | - | 90,515 | 62.13 | 6 | 5,189 | 3.56 | - | - | - | - | 5,124 | 3.52 | - | - | - | - | - | - | - | -45,662 | -31.34 | 145,681 | FL |
| Georgia | 14 | 41,089 | 27.72 | - | 107,162 | 72.28 | 14 | - | - | - | - | - | - | - | - | - | - | - | - | - | - | - | -66,073 | -44.57 | 148,251 | GA |
| Idaho | 4 | 88,975 | 65.60 | 4 | 46,579 | 34.34 | - | 38 | 0.03 | - | - | - | - | 32 | 0.02 | - | - | - | - | - | - | - | 42,396 | 31.26 | 135,624 | ID |
| Illinois | 29 | 1,420,480 | 67.81 | 29 | 534,395 | 25.51 | - | 74,747 | 3.57 | - | 49,630 | 2.37 | - | 11,216 | 0.54 | - | - | - | - | 3,471 | 0.17 | - | 886,085 | 42.30 | 2,094,714 | IL |
| Indiana | 15 | 696,370 | 55.14 | 15 | 511,364 | 40.49 | - | 24,703 | 1.96 | - | 16,499 | 1.31 | - | 13,462 | 1.07 | - | - | - | - | - | - | - | 185,006 | 14.65 | 1,262,964 | IN |
| Iowa | 13 | 634,674 | 70.91 | 13 | 227,921 | 25.46 | - | 16,981 | 1.90 | - | 10,321 | 1.15 | - | 4,197 | 0.47 | - | - | - | - | 982 | 0.11 | - | 406,753 | 45.44 | 895,082 | IA |
| Kansas | 10 | 369,268 | 64.75 | 10 | 185,464 | 32.52 | - | 15,511 | 2.72 | - | - | - | - | - | - | - | - | - | - | - | - | - | 183,804 | 32.23 | 570,318 | KS |
| Kentucky | 13 | 452,480 | 49.25 | - | 456,497 | 49.69 | 13 | 6,409 | 0.70 | - | - | - | - | 3,322 | 0.36 | - | - | - | - | - | - | - | -4,017 | -0.44 | 918,708 | KY |
| Louisiana | 10 | 38,538 | 30.49 | - | 87,519 | 69.24 | 10 | - | - | - | - | - | - | - | - | - | - | - | - | - | - | - | -48,981 | -38.75 | 126,396 | LA |
| Maine | 6 | 136,355 | 68.92 | 6 | 58,961 | 29.80 | - | 2,214 | 1.12 | - | - | - | - | - | - | - | - | - | - | - | - | - | 77,394 | 39.12 | 197,840 | ME |
| Maryland | 8 | 236,117 | 55.11 | 8 | 180,626 | 42.16 | - | 8,876 | 2.07 | - | 1,645 | 0.38 | - | - | - | - | - | - | - | 1,178 | 0.27 | - | 55,491 | 12.95 | 428,443 | MD |
| Massachusetts | 18 | 681,153 | 68.55 | 18 | 276,691 | 27.84 | - | 32,267 | 3.25 | - | - | - | - | - | - | - | - | - | - | 3,583 | 0.36 | - | 404,462 | 40.70 | 993,718 | MA |
| Michigan | 15 | 762,865 | 72.76 | 15 | 233,450 | 22.27 | - | 28,947 | 2.76 | - | 10,480 | 1.00 | - | 9,646 | 0.92 | - | - | - | - | 2,539 | 0.24 | - | 529,415 | 50.50 | 1,048,411 | MI |
| Minnesota | 12 | 519,421 | 70.59 | 12 | 142,994 | 19.43 | - | 56,106 | 7.62 | - | - | - | - | 11,489 | 1.56 | - | - | - | - | 5,828 | 0.79 | - | 376,427 | 51.16 | 735,838 | MN |
| Mississippi | 10 | 11,576 | 14.03 | - | 69,277 | 83.98 | 10 | 1,639 | 1.99 | - | - | - | - | - | - | - | - | - | - | - | - | - | -57,701 | -69.95 | 82,492 | MS |
| Missouri | 18 | 727,162 | 54.56 | 18 | 574,799 | 43.13 | - | 20,242 | 1.52 | - | 3,291 | 0.25 | - | 5,142 | 0.39 | - | - | - | - | 2,164 | 0.16 | - | 152,363 | 11.43 | 1,332,800 | MO |
| Montana | 4 | 109,430 | 61.13 | 4 | 57,372 | 32.05 | - | - | - | - | 12,204 | 6.82 | - | - | - | - | - | - | - | - | - | - | 52,058 | 29.08 | 179,006 | MT |
| Nebraska | 8 | 247,498 | 64.66 | 8 | 119,608 | 31.25 | - | 9,600 | 2.51 | - | - | - | - | 5,947 | 1.55 | - | - | - | - | - | - | - | 127,890 | 33.41 | 382,743 | NE |
| Nevada | 3 | 15,479 | 56.92 | 3 | 9,851 | 36.22 | - | 1,864 | 6.85 | - | - | - | - | - | - | - | - | - | - | - | - | - | 5,628 | 20.70 | 27,194 | NV |
| New Hampshire | 4 | 95,196 | 59.84 | 4 | 62,662 | 39.39 | - | 1,234 | 0.78 | - | - | - | - | - | - | - | - | - | - | - | - | - | 32,534 | 20.45 | 159,092 | NH |
| New Jersey | 14 | 611,541 | 67.65 | 14 | 256,887 | 28.42 | - | 27,141 | 3.00 | - | 2,200 | 0.24 | - | 4,734 | 0.52 | - | - | - | - | 923 | 0.10 | - | 354,654 | 39.23 | 903,943 | NJ |
| New Mexico | 3 | 57,634 | 54.68 | 3 | 46,668 | 44.27 | - | - | - | - | 1,104 | 1.05 | - | - | - | - | - | - | - | - | - | - | 10,966 | 10.40 | 105,406 | NM |
| New York | 45 | 1,871,167 | 64.56 | 45 | 781,238 | 26.95 | - | 203,201 | 7.01 | - | 18,413 | 0.64 | - | 19,653 | 0.68 | - | - | - | - | 4,841 | 0.17 | - | 1,089,929 | 37.60 | 2,898,513 | NY |
| North Carolina | 12 | 232,848 | 43.22 | - | 305,447 | 56.70 | 12 | 446 | 0.08 | - | - | - | - | - | - | - | - | - | - | - | - | - | -72,599 | -13.48 | 538,741 | NC |
| North Dakota | 5 | 160,072 | 77.79 | 5 | 37,422 | 18.19 | - | 8,282 | 4.02 | - | - | - | - | - | - | - | - | - | - | - | - | - | 122,650 | 59.60 | 205,776 | ND |
| Ohio | 24 | 1,182,022 | 58.47 | 24 | 780,037 | 38.58 | - | 57,147 | 2.83 | - | - | - | - | - | - | - | - | - | - | - | - | - | 401,985 | 19.88 | 2,021,653 | OH |
| Oklahoma | 10 | 243,831 | 50.11 | 10 | 217,053 | 44.61 | - | 25,726 | 5.29 | - | - | - | - | - | - | - | - | - | - | - | - | - | 26,778 | 5.50 | 486,610 | OK |
| Oregon | 5 | 143,592 | 60.20 | 5 | 80,019 | 33.55 | - | 9,801 | 4.11 | - | - | - | - | 3,595 | 1.51 | - | - | - | - | 1,515 | 0.64 | - | 63,573 | 26.65 | 238,522 | OR |
| Pennsylvania | 38 | 1,218,216 | 65.76 | 38 | 503,843 | 27.20 | - | 70,571 | 3.81 | - | 15,704 | 0.85 | - | 42,696 | 2.30 | - | - | - | - | 753 | 0.04 | - | 714,373 | 38.56 | 1,852,616 | PA |
| Rhode Island | 5 | 107,463 | 63.97 | 5 | 55,062 | 32.78 | - | 4,351 | 2.59 | - | - | - | - | 510 | 0.30 | - | - | - | - | 495 | 0.29 | - | 52,401 | 31.19 | 167,981 | RI |
| South Carolina | 9 | 2,610 | 3.91 | - | 64,170 | 96.05 | 9 | 28 | 0.04 | - | - | - | - | - | - | - | - | - | - | - | - | - | -61,560 | -92.14 | 66,808 | SC |
| South Dakota | 5 | 110,692 | 60.74 | 5 | 35,938 | 19.72 | - | - | - | - | 34,707 | 19.04 | - | 900 | 0.49 | - | - | - | - | - | - | - | 74,754 | 41.02 | 182,237 | SD |
| Tennessee | 12 | 219,829 | 51.29 | 12 | 206,558 | 48.19 | - | 2,239 | 0.52 | - | - | - | - | - | - | - | - | - | - | - | - | - | 13,271 | 3.10 | 428,626 | TN |
| Texas | 20 | 114,538 | 23.54 | - | 288,767 | 59.34 | 20 | 8,121 | 1.67 | - | - | - | - | - | - | - | 47,968 | 9.86 | - | - | - | - | -174,229 | -35.80 | 486,641 | TX |
| Utah | 4 | 81,555 | 55.93 | 4 | 56,639 | 38.84 | - | 3,159 | 2.17 | - | 4,475 | 3.07 | - | - | - | - | - | - | - | - | - | - | 24,916 | 17.09 | 145,828 | UT |
| Vermont | 4 | 68,212 | 75.82 | 4 | 20,919 | 23.25 | - | - | - | - | - | - | - | 774 | 0.86 | - | - | - | - | - | - | - | 47,293 | 52.57 | 89,961 | VT |
| Virginia | 12 | 87,456 | 37.85 | - | 141,670 | 61.32 | 12 | 807 | 0.35 | - | 243 | 0.11 | - | 857 | 0.37 | - | - | - | - | - | - | - | -54,214 | -23.47 | 231,033 | VA |
| Washington | 7 | 223,137 | 55.96 | 7 | 84,298 | 21.14 | - | 8,913 | 2.24 | - | 77,246 | 19.37 | - | 3,800 | 0.95 | - | - | - | - | 1,321 | 0.33 | - | 138,839 | 34.82 | 398,715 | WA |
| West Virginia | 8 | 282,007 | 55.30 | 8 | 220,789 | 43.30 | - | 5,618 | 1.10 | - | - | - | - | 1,528 | 0.30 | - | - | - | - | - | - | - | 61,218 | 12.00 | 509,942 | WV |
| Wisconsin | 13 | 498,576 | 71.10 | 13 | 113,422 | 16.17 | - | 80,635 | 11.50 | - | - | - | - | 8,647 | 1.23 | - | - | - | - | - | - | - | 385,154 | 54.92 | 701,280 | WI |
| Wyoming | 3 | 35,091 | 64.15 | 3 | 17,429 | 31.86 | - | - | - | - | 2,180 | 3.99 | - | - | - | - | - | - | - | - | - | - | 17,662 | 32.29 | 54,700 | WY |
| TOTALS: | 531 | 16,144,093 | 60.32 | 404 | 9,139,661 | 34.15 | 127 | 913,693 | 3.41 | - | 265,398 | 0.99 | - | 188,787 | 0.71 | - | 47,968 | 0.18 | - | 31,084 | 0.12 | - | 7,004,432 | 26.17 | 26,765,180 | US |
Close states
Margin of victory less than 5% (25 electoral votes):
- Kentucky, 0.44%
- Tennessee, 3.10%
Margin of victory between 5% and 10% (10 electoral votes):
- Oklahoma, 5.50%
Statistics
Counties with Highest Percentage of the Vote (Republican)
- McIntosh County, North Dakota 95.76%
- Leslie County, Kentucky 94.22%
- Sevier County, Tennessee 93.60%
- Sheridan County, North Dakota 92.98%
- Billings County, North Dakota 92.81%
Counties with Highest Percentage of the Vote (Democratic)
- Chester County, South Carolina 100.00%
- Edgefield County, South Carolina 100.00%
- Clarendon County, South Carolina 100.00%
- Bamberg County, South Carolina 100.00%
- Hampton County, South Carolina 100.00%
Counties with Highest Percentage of the Vote (Other)
- Austin County, Texas 61.72%
- Fort Bend County, Texas 59.35%
- Lavaca County, Texas 57.76%
- Fayette County, Texas 55.12%
- Washington County, Texas 54.04%
See also
- History of the United States (1918–1945)
- History of the United States Democratic Party
- History of the United States Republican Party
- Inauguration of Warren G. Harding
- United States Senate election, 1920
Notes
- ^ "Voter Turnout in Presidential Elections". The American Presidency Project. UC Santa Barbara.
- ^ David Leip. "Dave Leip's Atlas of U.S. Presidential Elections". Uselectionatlas.org. Retrieved August 18, 2016.
- ^ "The enemy within; the inside story of German sabotage in America : Landau, Henry, b. 1892 : Free Download & Streaming : Internet Archive". Archive.org. Retrieved August 18, 2016.
- ^ "Essay by M. Plowman (2009) on the complexities of the "Indo-Irish-German" conspiracy in the USA during the war" (PDF). Lse.ac.uk. Retrieved August 18, 2016.
- ^ American Rhetoric, "Final Address in Support of the League of Nations", Woodrow Wilson, delivered September 25, 1919 in Pueblo, CO.
- ^ "Dáil Éireann – 29/Jun/1920 MINISTERIAL MOTIONS. - PRESIDENTIAL ELECTION CAMPAIGN IN U.S.A". Oireachtasdebates.oireachtas.ie. February 24, 2015. Retrieved August 18, 2016.
- ^ Sinclair, p. 168
- ^ Sinclair, p. 162
- ^ Sinclair, p. 163
- ^ "1912". President Elect. Retrieved August 18, 2016.
- ^ The Presidential Vote, 1896–1932 – Google Books. Stanford University Press. 1934. Retrieved August 12, 2014.
- ^ The Presidential Vote, 1896–1932, Edgar E. Robinson, p. 19
- ^ The Presidential Vote, 1896–1932, Edgar E. Robinson, pg. 21
- ^ "1920 Presidential General Election Data – National". Uselectionatlas.org. Retrieved March 18, 2013.
References
- Bagby, Wesley M. (1962). The Road to Normalcy: The Presidential Campaign and Election of 1920. Baltimore: Johns Hopkins Press.
- Boller, Paul F., Jr. (2004). Presidential Campaigns: From George Washington to George W. Bush. New York: Oxford University Press. pp. 212–217. ISBN 0-19-516716-3.
{{cite book}}: CS1 maint: multiple names: authors list (link) - Cooper, John Milton (2001). Breaking the Heart of the World: Woodrow Wilson and the Fight for the League of Nations. New York: Cambridge University Press. ISBN 0-521-80786-7.
- Duff, John B. (1970). "German-Americans and the Peace, 1918–1920". American Jewish Historical Quarterly. 59 (4): 424–459. ISSN 0002-9068.
{{cite journal}}: Cite has empty unknown parameter:|month=(help) - Duff, John B. (1968). "The Versailles Treaty and the Irish-Americans". Journal of American History. 55 (3). Organization of American Historians: 582–598. doi:10.2307/1891015. ISSN 0021-8723. JSTOR 1891015.
- McCoy, Donald R. (1971). "The Election of 1920". In Schlesinger, Arthur M., Jr.; Israel, Fred L. (eds.). History of American Presidential Elections. New York: Chelsea House. ISBN 0-07-079786-2.
{{cite book}}: CS1 maint: multiple names: editors list (link) - Morello, John A. (2001). Selling the President, 1920: Albert D. Lasker, Advertising, and the Election of Warren G. Harding. Westport, CT: Praeger. ISBN 0-275-97030-2.
- Pietrusza, David (2007). 1920: The Year of the Six Presidents. New York: Carroll & Graf. ISBN 0-7867-1622-3.
- Sinclair, Andrew (1965). The Available Man: The Life behind the Masks of Warren Gamaliel Harding. New York: Macmillan.
- "The Presidential Election of 1920". American Leaders Speak: Recordings from World War I and the 1920 Election. Library of Congress. Retrieved November 16, 2002.
Further reading
- Eugene V. Debs, A Word to the Workers! New York: New York Call, n.d. [1920]. —Socialist campaign leaflet.
External links
- Presidential Election of 1920: A Resource Guide from the Library of Congress
- 1920 popular vote by counties
- 1920 Election Links
- How close was the 1920 election? — Michael Sheppard, Massachusetts Institute of Technology
- Election of 1920 in Counting the Votes
.jpg)
