
Wikipedia:Featured picture candidates/Hematopoiesis
Hematopoiesis[edit]
Voting period is over. Please don't add any new votes. Voting period ends on 20 Jun 2010 at 07:57:05 (UTC)
_diagram.png)
- Reason
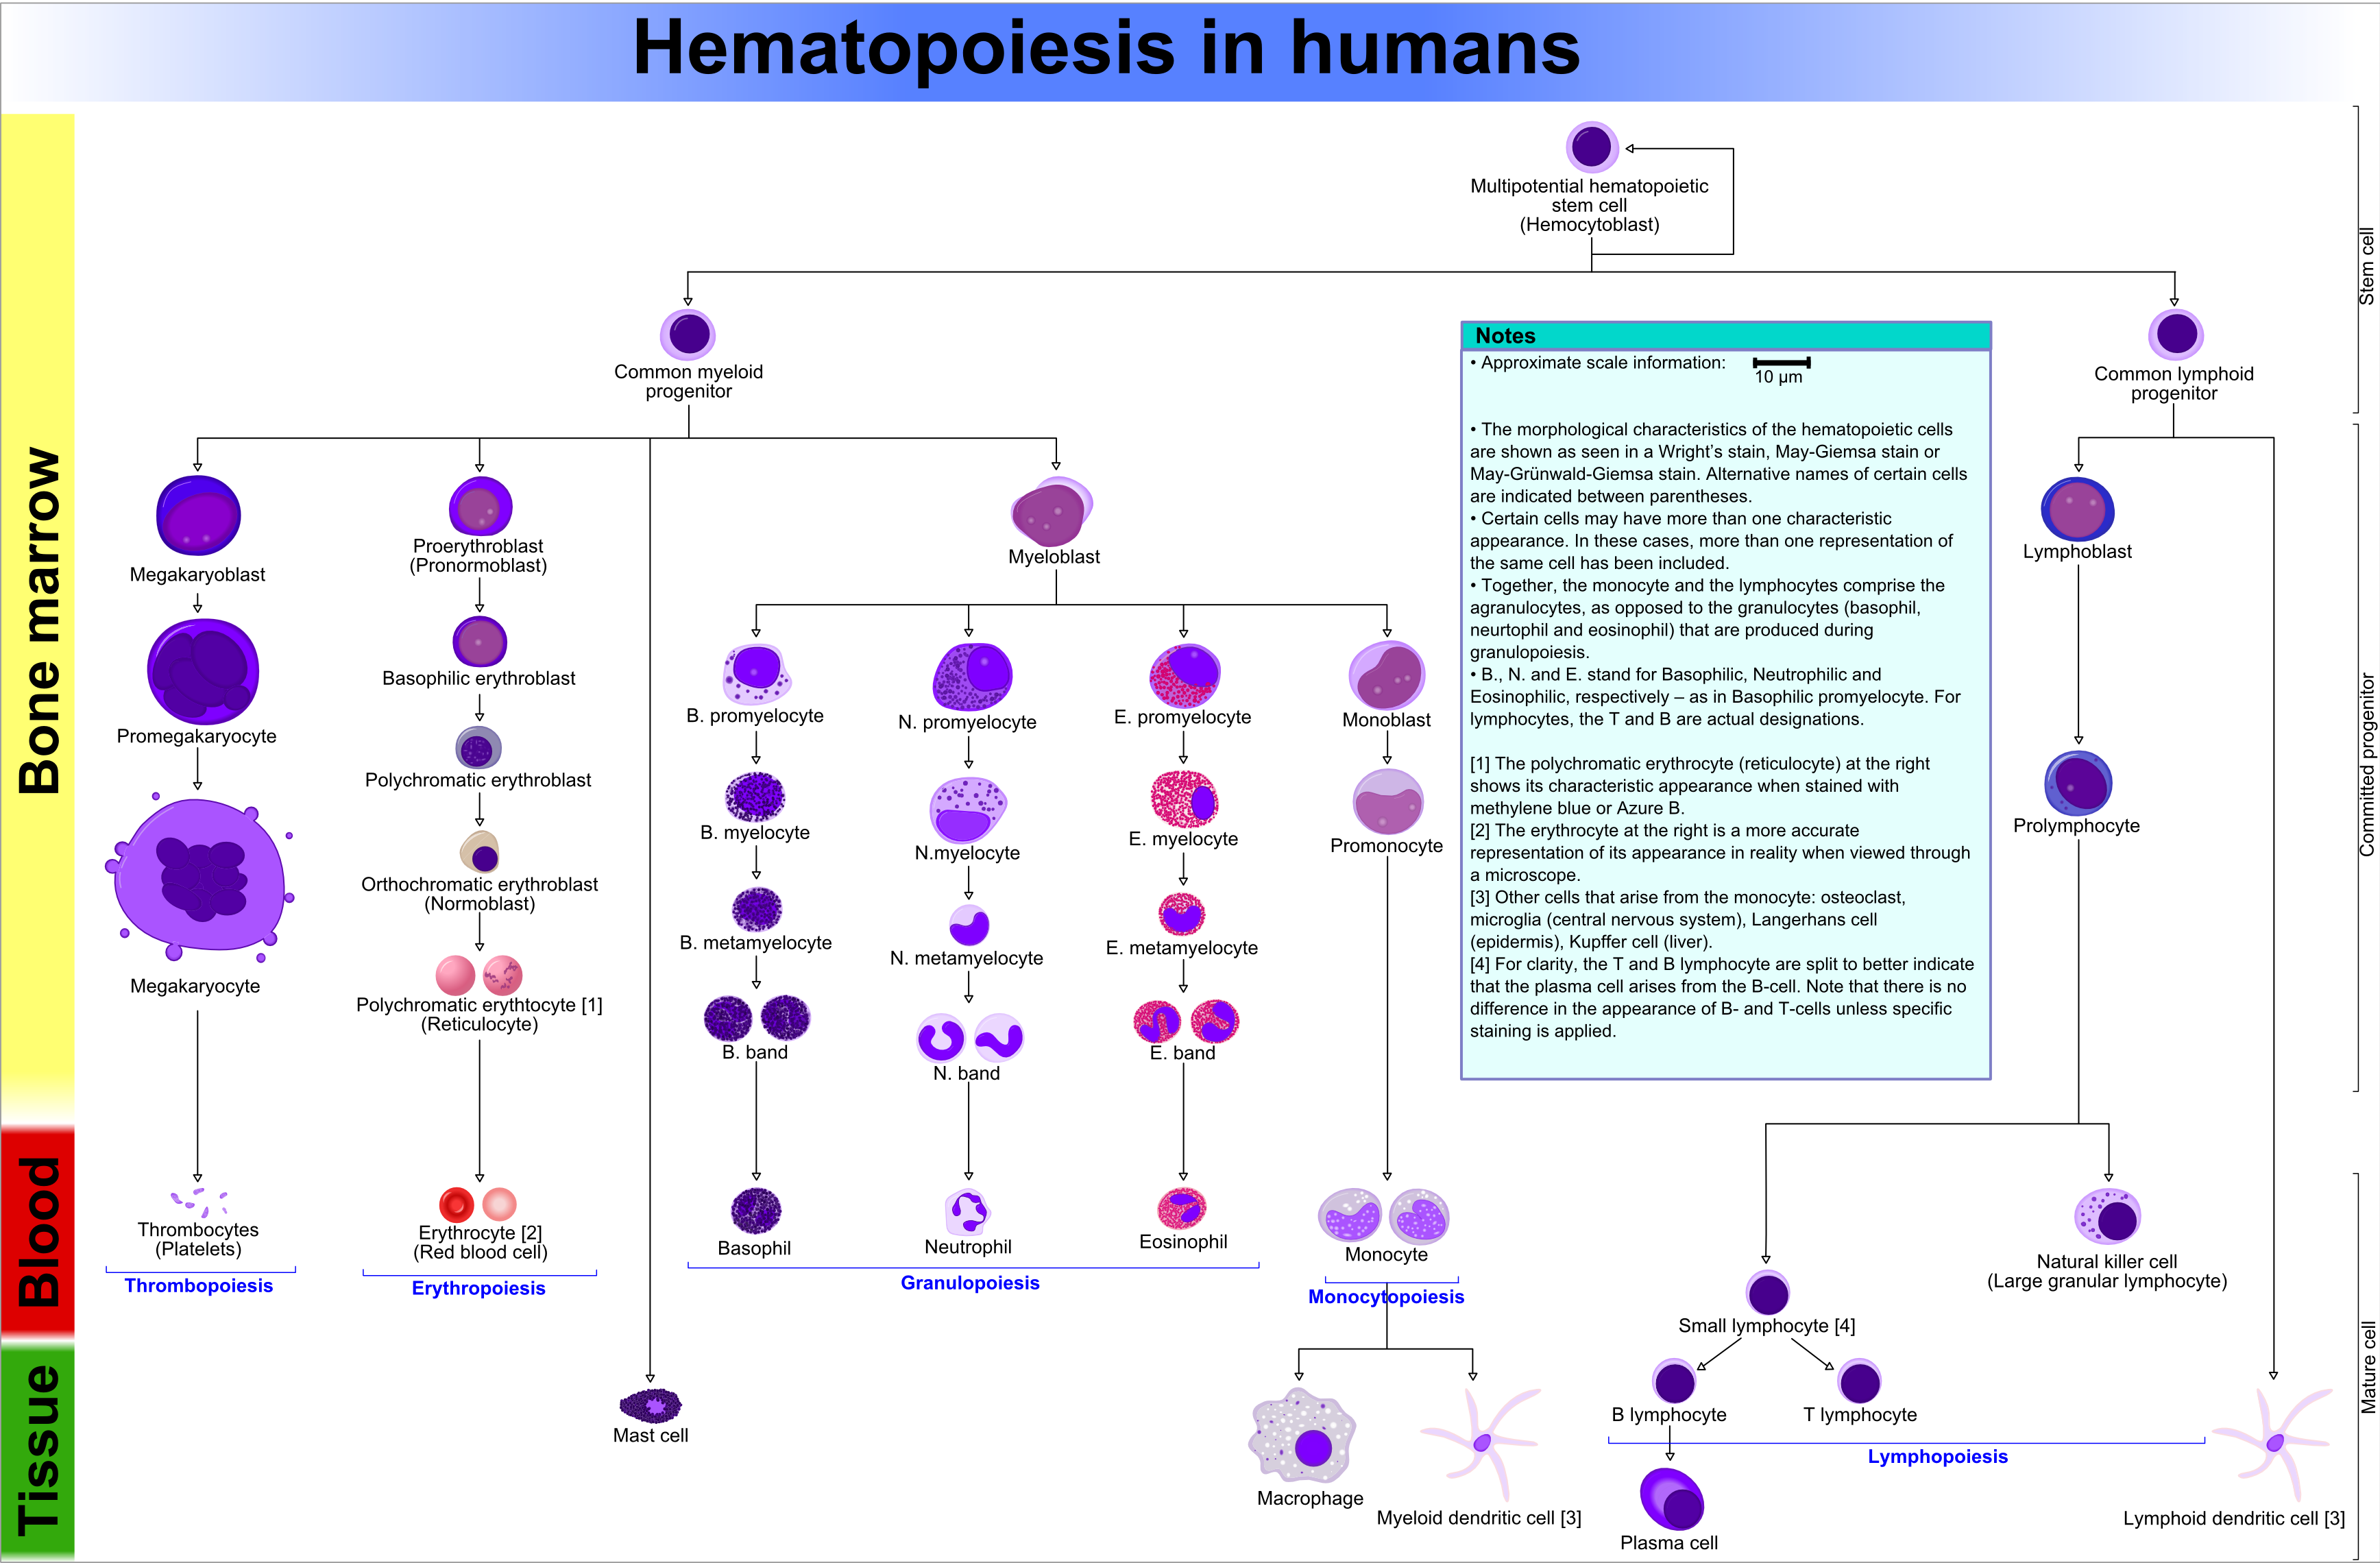
- This image has huge educational value, is well researched and very detailed in depicting the characteristics of different kinds of blood cells. A vector version of this image is available, but is rendered incomplete in MediaWiki (but is complete when editing in external programs) making it unsuitable for nomination.
- Articles in which this image appears
- 15 in English Wikipedia, including Haematopoiesis, Erythropoiesis and Hematopoietic stem cell. Complete list found in image page
- FP category for this image
- Wikipedia:Featured pictures/Sciences/Biology
- Creator
- User:A. Rad
_diagram_en.svg)
- Support as nominator --Mikael Häggström (talk) 07:57, 11 June 2010 (UTC)
- Oppose The optical scaling is wrong. The placement and relative font size makes it look like this was originally (I know it wasn’t) a cork board-size presentation in the hallway at a university’s science department. Even zoomed way in, the text is too small. I wish I could vote yes, since graphics like this add immeasurably to articles and require a lot of time to make. It just needs to be revised to better exploit the available white space. Greg L (talk) 15:41, 11 June 2010 (UTC)
- Yes, there is a lot of unused and distracting whitespace, but I'm confused about what text is too small? The image is 4000+px × 2700+px, and when viewed at its full resolution the text is quite readable. Also, when compared directly to the "splodges", it is neither too small nor too large that it distracts from the splodges. How are you viewing the image to judge it? Via the thumbnail, or the 800 × 524 px preview on the file page? I was always under the impression that images should be viewed and judged at full resolution, but reading your comment makes me wonder if I've been wrong. Matthewedwards : Chat 21:44, 12 June 2010 (UTC)
- Note this CNN page. That is the typical 1024-pixel width of window that modern webmasters design for. It is wise that we follow this practice. Below this 1024-pixel-width, horizontal scroll bars appear (people with 640-pixel monitors will just have to scroll). On my Mac running OS X and using Safari as a browser, the horizontal scroll bar appears if I make the window any narrower than 1018 pixels. Try making a window that is just big enough accommodate CNN with no horizontal scroll bar. And then hit the “back” button to come back here. Go ahead; I’ll wait…
♬♩ (*elevator music*) ♬♩…
Now go to this full-size, closeup of the chart. Look how small the text is. What are those categories on the very far right? I haven’t yet zoomed in far enough to read them, but I can see that one is supposed to be able to read them. Zooming around deep into panoramas with 7:1 aspect ratios is to be expected. But, seriously, graphics like this should be usable without zooming around as if one is looking at the world through a toilet paper tube; particularly when there is so much blank whitespace to expand into. The text is far, far too small. Greg L (talk) 22:14, 12 June 2010 (UTC)
P.S. Whenever possible, I try to make charts usable in the placed size, like here at Stability of the International Prototype Kilogram, with no need to even click on them. Having to click on them, and then click “Full resolution” and then click the zoom magnifier and scroll around toilet-paper-tube-style, isn’t what I call “Featured Picture” practices. Greg L (talk) 22:36, 12 June 2010 (UTC)
- Note this CNN page. That is the typical 1024-pixel width of window that modern webmasters design for. It is wise that we follow this practice. Below this 1024-pixel-width, horizontal scroll bars appear (people with 640-pixel monitors will just have to scroll). On my Mac running OS X and using Safari as a browser, the horizontal scroll bar appears if I make the window any narrower than 1018 pixels. Try making a window that is just big enough accommodate CNN with no horizontal scroll bar. And then hit the “back” button to come back here. Go ahead; I’ll wait…
Comments (Well, questions, mostly for the image creator)
- What do the small numbers with one parenthesis represent. As in "Myeloid dendritic cell 3)" and "snall lymphocite 4)" and the like. There doesn't appear to be information on this in the notes box
- The scale bar in the notes box is a bit odd.. Does 10µm represent the entire scale bar, or is the white bit 10µm and the black bit 10µm?
- Are the "blobs" images you've created out of your own mind, or do they actually have these shapes and colours under the microscope in real life?
- There are some labled "B. myelocyte" and "E. promyelocyte", but others as "B lymphocyte" and "T lymphocyte", without the full stop/period. Should the B and T lymphocytes have the period?
- Also, I'm wondering why a png version has been nominated, when, when done correctly, .svg files for diagrams are often superior. With different layers for text, blobs, etc, it could be easily edited and translated into different languages, and would scale better. (I noticed the current svg version of this file, File:Hematopoiesis (human) diagram en.svg uses shitty fonts, though and has lost some of the artistry of the blobs.)
Best, -- Matthewedwards : Chat 22:10, 12 June 2010 (UTC)
- I'm the nominator of the picture, not the creator, so I'm not familiar with those information issues. As to the nomination of the .png-format, I did it because noticed that the one in .svg is incompletely rendered in MediaWiki. It is fully functional in external programs to make other derivatives, but I think some fixes should be done in MediaWiki before that version can be promoted. Mikael Häggström (talk) 11:05, 17 June 2010 (UTC)
Not promoted --Makeemlighter (talk) 18:08, 20 June 2010 (UTC)