
Wikipedia:Graphics Lab/Resources/Research and Development
| |||
This page is designed to allow discussion of possible new standards for images or standards for creating them. Note that the completely finalized standards or methods will be displayed on Wikipedia:Graphics Lab/Standards and Wikipedia:Graphic Lab/Tutorials, respectively. All people are welcome to propose and discuss new ideas for standards here.
PS: don't hesitate to hide texts to make summarizations ! This keep the page clear and understandable.
A note on terminology and intent[edit]
The idea of this page is to create standards for classes of images on Wikipedia. By creating these standards and applying them to new and old images, we can obtain a professional look of uniformness and ease of understanding the information.
However, it must be known that none of these "standards" are immutably established, nor are they binding or mandatory on anyone who uploads an image to Wikipedia (or Commons). A standard should succeed by both vigorous promotion (IE. We convert all the images subject to it to the new standard), and its clear superiority to anything else out there.
Starting discussion for a new standard[edit]
If you have an idea for a new standard, an addition to a standard, or something worth discussing here, you are welcome to bring it up for discussion. New discussions with a clear explanation, an understandable intent, and (especially) images for explanation or as examples will generally go the farthest.
Anyone is welcome to comment on or suggest proposals, including creating example images. This is not restricted to those who have been around before, or who have done work for the graphics lab previously.
As with any discussion, keep in mind that it's not a matter of voting, but an attempt to find the best option by discussions. Similarly, any discussions should remain civil and cool, remain on topic, and not become rancorous or a competition between people instead of between ideas.
Questions[edit]
- Please see WP:AG/FAQ to ask questions about the graphics lab, etc. If you want to propose a standard, but want to ask ahead of time, you can do so there, or just propose it below.
Currently in discussion[edit]
Amazing recent activity ![edit]
Hello, someone may him explain why the English Graphic Lab is suddenly became really famous , getting about 3 requests a day !!? If you have a secret under this, other graphic Labs are interested to learn about it ! (did you made an adversing campaing ? how ? etc.) Yug 18:56, 8 January 2008 (UTC) I don't really know, but as you've asked me on my talk page, I'll respond. I've only been hanging around there for a month or so. I am presently between jobs, and so have spent a lot of time there, and so have been able to help get things done. I've found it to be interesting and fun, I've learned a lot by doing the projects, and seem to have pleased a few of those who have brought things in. Chris (クリス) (talk has been bringing a lot of things in; he always has a couple of requests active. He may know your answer. Cheers! Sagredo⊙☿♀♁♂♃♄ 14:00, 9 January 2008 (UTC)
- Hi Yug, no, there's no advertising campaign, I think what it is, is that there is such a dedicated batch of artists at the Lab that do such nice images, quickly too, word gets around. It just takes time, most Wikipedians don't know the Lab exists, I was here a year before I knew. I recommend to every group I am active in that any images should be posted there, but that doesn't get a lot of action. I think it's just satisfied customers coming back. Chris (クリス) (talk) 01:54, 10 January 2008 (UTC)
- Two more thoughts.
- The English Wikipedia is still the largest by far, with the most users, so that explains it. The Spanish and Luxembourgish ones are comparatively small.
- Laws of other countries are strong on images. Japanese is a huge Wikipedia, but they have no Graphics Lab.
- Chris (クリス) (talk) 03:26, 10 January 2008 (UTC)
- Oh, ok... This week, you were about 2 or 3 time more active than the French teams. If you keep this speed :
- it will be probably be need to split the GL into Photo clean up/PNG-SVG
- you will become the most active Lab, some especially skilled users will appear (both in graphic and leadership abilities),
- accordingly, you will probably have the energy to "lead" the global developpement of all the graphic labs (this leadership was and is still mainly on the French team's hands). I think this transfert of power may -if it do- occure in 2009 (the French have currently far more standards and conventions)
Summary:
- Boom of activity : the English graphic lab have, apparently for no special reason (out of Segredo special disponibility and Chris active image hunting), a recent boom of his activity close to 3-4 request a day.
- Take the lead : This recent boom and the size of the English wikipedians community let think that the English Graphic lab will, in end of 2008 or in 2009 as well, take the leadership in terms of production and research and development.
- 2008 = follow the French standards : by the way, it was encourage to follow French team's standard for the moment, to avoid waste of energy on both side.
International Harmonization of GLabs' Recommendations, IMPORTANT :[edit]
The several now active Graphic Labs are meeting difficulties which lead each graphic lab to set up graphic recommendations/standards. This section note how we should work for the moment to avoid wast of time and energy. :
- The English GLab is encourage to follow and copy the French choices and standards/recommandations, to avoid recommandations splits which may produce huge waste of time. ;
- a recommendation is composed by series of optimized rules (names' conventions, encouraged colors) and series of tools (list of icons to uses, links towards sources)
- feel free to create new recommandations/standard/legends, this is helpful ! but make them as proposal which may be merge into the current french recommandations (you can apply them for creation, but keep in mind that new global standard will come) ;
- when you think one proposal is optimized, propose it to fr:User talk:Sting for maps (icons, colors, etc), and fr:User talk:Walké or :fr:Séhmur for other conventions.
- This because these skilled graphists are currently listing all maps and graphic recommandations in the aim to produce by mid 2008 (?) some new Wikimedia graphic's (maps/diagrams) uniformized, optimized, and strongly encouraged recommandations/standards.
- Afterwhat, all maps (and many diagrams) on Wikipedia will have to be edit according to these recommandations. A global work probably on more than 5.000 images is planned for 2008-2009-2010 (Yes... huge project...), where all graphic Labs will have to collaborate.
The last thing, is that I encourage you to now (that you are really active ;] ) create your own Wikipedia:Graphic Lab/Research and development for your own development and to overview the tutorials, the various news pages you create + have a graphist mediator always aware of new development on the French Graphic lab (fr). This again to avoid waste of time.
Your /Research and development may be first based on this post, and then expand by your teams.
Good Luck into your grow ! Your team still have lot to do, but I'am happy to see that the English GLab is now moving to a pretty good success and development. Muahaha ! Let's Roll !
Yug 06:31, 10 January 2008 (UTC)PS: for the next year I will just make about 5 edits a month. I will just come to post you some summaries such this one. Sorry to don't be able to help more.
Comments:[edit]
- This looks like a very sensible proposal, and I support it wholeheartedly. Unfortunately, my French is not good, so I will only be of limited assistance in translating recommendations. --Slashme (talk) 11:09, 10 January 2008 (UTC)
- We need a regular interpreter (English<->French G. Labs) :
- We need a regular interpreter (English<->German G. Labs) :
- You'll be very valuable, Slashme, as usual. The teaching of languages here in the U. S. is/has been woefully lacking. I had some French in high school, but that was way back when, and if I try to read it today I understand only about every tenth word. Fortunately the other Anglophone countries have done much better. Perhaps we should put a note near the top of the main page and the project page that we need a regular interpreter. I think there's also a page with a list of wikipedians who speak French, somewhere. . .
- The English Wiki is about 3.5 times the size of the French Wiki by number of articles. We should anticipate that growth of the graphics lab could could be rapid. Sagredo⊙☿♀♁♂♃♄ 16:15, 10 January 2008 (UTC)
- The other possibility for this issue is to have a new French user taking this task, since many french wikipedians/graphists speak both French and English. But we should avoid Sting, Sehmur, Styx, who should use their time and skills to set up the conventions, no to talk about it.
- But I still encourage you to "hire"
- 1/ english wikipedian,
- 2/ able to understand French talks and graphic vocabulary,
- 3/ interested by the graphic Lab.
- He main work will be to keep an eye [watch] this French page (:fr:GLab/Recherche et développement), time by time to update the english version of the same page, to be disponible to the French graphists (who will have to know his/her name and where cantact him/her).
- Put a note near the top of the page listing wikipedians who speak French with this points may be good.
- Yug 05:34, 11 January 2008 (UTC)
- Putting the page through Babelfish [1] I do get some of it. One important thing I note is that the same situation exists with the German graphics lab. So a English-German would be useful as well. Ideally, someone who knows graphics and speaks all three languages. She just might exist. LadyofHats writes in English, lives in Germany, speaks Spanish, and has a user box that looks like French to me. She's such an awesome artist that she's running her own private graphics lab, in a way it's a shame to ask for her time as a translator. But, I will put a note on her user page. Yug, you may also wish do so also, as you can explain the situation better than I. Sagredo⊙☿♀♁♂♃♄ 19:04, 11 January 2008 (UTC)
- Despite I was not aware that Ladyofhats was speaking all this languages, I already noticed LadyofHats, but his graphic work is AMAZING enough to let him work in peace, like Sting and his maps, and Fir0002 and his photos, and time by time to pry them to write down tutorials. Accordingly, I encourage to don't ask him to be our interpret. Yug 18:10, 12 January 2008 (UTC)
- I can be one of your (or your only, but maybe sporadic) interpret, I qualify for : "1/ english wikipedian", "2/ able to understand French" it's just the "understand graphic vocabulary" part I'm not so sure about. Anyway, I'll happily translate anything if someone leaves me a word on my talk page. Pro bug catcher (talk • contribs). 20:48, 25 February 2008 (UTC)
Summary: we need users to keep a coordination between our Graphic Labs and graphic standards, this to avoid huge waste of time.
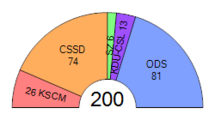
Proposed standard on the display of legislatures' compositions[edit]
Reading the above comments about standards gave me an idea of one area where we could easily standardize (And I didn't see this already dealt with on fR, but I don't know French): Representative distributions. Currently this is a mess, EG:
-
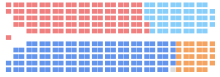 The Canadian seating chart idea
 -
 Japanese election style, 1 dot / one deputy system. Legend include in the SVG.
 -
A seating chart form
-
 This more common version (May be worth getting a copy of the software that generated it)
 -
 Japanese circle style.
 -
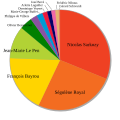 French presidential election, 2007 1st.svg
 -
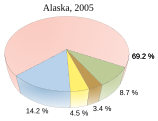 Alaska RaceComposition2005 PieChart.svg, 3D view.
 -
 A new version, with dotes. This one really ,looks strange.


Does anyone think that it would be worth picking a standard of display of representation and slowly converting everything else to it (As well as, hopefully, having the new electoral images follow it)? Thanx, 68.39.174.238 (talk) 18:56, 11 January 2008 (UTC)
- Yes,
but the French already working on standards for pie charts[1]. Another is that such standards should be the same for 3 labs. A Babelfish [2] translation of the page will give you an idea of what they're talking about. We should at least try to get an English version of the existing French standards. Some would likely be adopted, others, we will want to set the standard. Sagredo⊙☿♀♁♂♃♄ 19:16, 11 January 2008 (UTC)
- ^ Euh... I think [80% sure] the french haven't any pie chart's standart for the moment. This means that if you want set up an optimized recommandation : the way if free and that's will be really Welcome ! Your ideas are gold coins !!;] Yug ~~~~~
- That's the thing though, do we want electoral representation images to be pie charts? The Japanese idea is interesting, especially since it can be used to show what parties have the relevant (super)-majorities. Granted, we could do that with a semicircle as well, Do you think we could do that? Have, say, a SVG chart like the Czech one, but with the constitutionally specified majorities and supermajorities indicated on it? I'm thinking that something like the United States Senate would end up like: A 100 member house, with the divisions at 49, 51, and 100 (Democrats, Democrats + caucusing Independents, Republicans), and divisions indicated at 50, 60 and 67 members, counting from the current majority outward. Also, I suggest that the majortarian party/coalition be on the left and the various majorities (½, 2/3, etc) all be based on that side. I wish I could make images to show you what I'm thinking of. 68.39.174.238 (talk) 07:39, 12 January 2008 (UTC)
Current Proposal[edit]
|
This standard's proposal is now at "90% set up", your comments are welcome in the "Comments" section. Then, set the last 10% will need discussions/critics, images creations, and true tests which will ask lot of work and time too. Yug
|


- Here is a draft proposal, listing the mains parameters of this kind of charts, and giving my opinion about each of them.
- Semi-circle and circle system : I don't really like semi-circle or circle. Why ? Because despite to be really clear, they have to show roughly two informations : the right number of deputy by color + the area of each color (in % of the circle). And I think that this last points is difficult to edit on a SVG, difficult to check, and so may be falsified (i.e. a pro-republican may display the republican area bigger than is true %).
 refused. Not convenient untill we don't have an easy way to make and check that each color area is conform to it's pourcentage.
- One deputy/One colored point system: I like more this system. Because : 1/ editable by every SVG newbie, 2/ quickly checkable by everyone, 3/ easily expandable, 4/ the % can perfectly be remove to the Image:page.svg and in the article.
 proposition supported : seems to me to be the best way to be easily makable, clear, and checkable.
- Displaying the Assembly shape system : seem useless. That's more difficult to provide/draw, is different for every countries, and make then like that will ask us lot of work without comparative gain in the message.
- refused.
- 3D view VS 2D view (circle pie charts) : don't seems interesting. It look like one more difficulty adding to already existing difficulties link to 2D pie chart.
- refused.
- Colors ? : I prefer soft colors such display in the 1st and 4th images. An SVG displaying the list of the 12 (?) recommended soft colors should be create.
- proposition valided : don't seems controversial. Stay to create an SVG listing the 12 (?) soft colors recommended, please wait the first attempt.
- Include in the Image : country name or province name, years of vote ; total number of seats ; number of seat for each group/color ; % of each group (this is it really need here ?), exact day when the data was pick up such as "YYYY/MM/DD" (where to put this) . Do do not include (not forget) : groups' names (need on the image ? may be display on the legend using {{legend}}), explanations (should clearly be in the article)
- proposition valided : seems to me the best optimization. To see clearly where put what, please wait the first attempt.
- Exclude from the Image, include in the article : Legend explaining what means each color using the template {{legend}} : {{legend|#0000ff|Republican}} = Republicans (127 seats; 43%), with the number of seats and % of each groups.
- proposition valided : seems to me the best optimization.
- Naming convention : the name should contain all the following data : Country name, election name, year, language code (? not need if we agree to always produce free-of-text charts), and round number.
A proposition of recommendation, underlining the Country :
Countryenglishname_YYYY's_ElectionName -languagecode.svg , i.e. : Japan_2007's_House of Councilors election_1st-en.svg.
If you have a doubt for these names just check Wikipedia's article, i.e. Wikipedia use fluent names such as "French legislative election, 2007". But this should be put into basic english such as : France 2007's legislative election 1st-fr.svg (Taiwanese -> Taiwan ; Kenyanese ? Kenyan ? -> Kenya 2007's ...). ? proposition : seems to me the best optimization for international use -> validated, except if this name seems really ugly to native english speakers' ears (then -> French legislative election, 2007 1st-fr.svg, based on article's name.).
- For standard creation, we have to keep in mind: that the image should be perfectly clear, able to say quickly and clearly the facts. In Wikipedia : the illustration will be accompanied by a legend, an article, etc , but the image will also be print by high school students, and so the image file need to bring the basis to be a good start point of a presentation. 1/ the filename provide the context Japan 2007 House of Councilors election-en.svg , 2/ the image provide the data : year ; total number of seat ; seats by group ; % by group , 3/ yes, we expect from our "high school student" to be able to read file name and to remember the topic of his speech... 4/ but what provide the groups names ? I think we should also expect from our high school student to remember the image's legend and articles comments.
- Yug 13:19, 12 January 2008 (UTC)
Comments[edit]
- Pie chart, or list of colored dot ?
This current proposal finally encourage to avoid pie charts. Despite their good looking, they don't offer enough guarantees of accuracy to be raise to the level of a recommendation. I'm myself a little disapointed by this conclusion, but I had to make a choice between "Good looking" and "Easy to do, to check", I chosen the second one. If you know a way to color disk on Inkscape into pie charts by seting the % of each part, they please tell it. Yug. 17:55, 12 January 2008 (UTC)
Could I ask why some were arbitrarily marked "rejected" and how this is "90%" done? I think 3 people (Myself, you and User:Sagredo) have commented on this: far to few to be able to arbitrarily declare a standard and certainly not enough to "reject" proposals out of hand which obvious have some merit (They're being used in at least one articel). 68.39.174.238 (talk) 21:26, 12 January 2008 (UTC)
- How to set up an optimized recommendation ?:
- This text have been move to Wikipedia talk:Graphic Lab/Research and Development#How to set up an optimized recommendation ?
- Yug 09:34, 14 January 2008 (UTC)
- I'm not (for obvious reasons) really involved with the means of consensus here, but I think that's a French system and not a universal one. The rough and ready blanket-primary-of-systems we have here seems to be working (Especially since this doesn't involve major wiki politics like pagemoving, etc.). Once a standard is adopted, it should be fairly easy for everyone (here) to follow it. 68.39.174.238 (talk) 16:27, 13 January 2008 (UTC)
- It's certainly time to start the page Editing Wikipedia:Graphic Lab/Research and Development and move this there. Perhaps put a note on the appropriate German and French pages, even if it's in English and on the images to improve page, everyone should be welcomed to make comments on the English page any language. I think English will prove to be the most universal, but with any luck we'll get translators as well. Perhaps we'll end up with a trilingual page.
- Slashme is a chemical engineer, and he has/knows about software which will generate all sorts of charts from raw data. Fvasconcellos may very well will know something as well. I left notes on their talk pages.
- About all I can put in is the layman's point of view. And that just for the U. S. I think the public is very used to circular pie charts for things like budgets. Seating charts for things like legislatures. I really don't have the technical knowlege to keep up with this. I did study engineering, but that, too was a while back. [3] Sagredo⊙☿♀♁♂♃♄ 23:53, 12 January 2008 (UTC)
I have had a look at the alternatives, and I strongly support the one-representative one-dot system. It gives more information at a glance than the pie chart: The pie chart shows you the balance of representation, but the dot-chart also shows you which parties only have one rep or two reps in sitting. The seating plan is cute, but I agree that it's not worth the added effort, and is inefficient in terms of pixels used per amount of information presented. --Slashme (talk) 06:52, 13 January 2008 (UTC)
- Ok, I also made this choice because it's the most efficient. It stay to find a way to be nice and efficient in the same time : delete space between square ? use dot ? etc. Yug 15:09, 13 January 2008 (UTC)
- NO. If you run all of the squares together, then you have to guess at the true number. With a separation, you can just multiply the rows by columns and add any extras. 68.39.174.238 (talk)
As for the soft colours, nice idea to keep a standard SVG for this purpose. --Slashme (talk) 06:52, 13 January 2008 (UTC)
- Ok. Yug 15:09, 13 January 2008 (UTC)
- I suggest using the locally (EG. Within the legislature's jurisdiction) understood symbols.
Talks about Slashme's script solution[edit]
- See also : Slashme's current script and the associated talk page
How about giving the option of making it an HTML table (wikitable?) or an SVG at the user's discretion? It could in principle look exactly the same, and has some technical advantages when you have a grid, and might be easier to fix for people without graphic design experience or software when a by-election changes one seat. --Slashme (talk) 06:52, 13 January 2008 (UTC)
I'll look into methods of automatically generating the SVG of the table. I'm sure it can't be too hard, in fact it might be possible to do by template! --Slashme (talk) 06:52, 13 January 2008 (UTC)
- Interesting idea, we are here to test new ways... so go ahead if you think that can produce a gain. Yug 15:09, 13 January 2008 (UTC)
- I suggest it be Wikipedia:Graphics Lab/Standards and/or Wikipedia:Graphics Lab/Standards/New, as that seems to be our main intent. As to the colors, I recommend that we just follow the party color templates already existing. If someone would be willing to create those pages, I will write up a formal standard based on what's been going on here, and you people (the ones who will actually be making these graphs) can correct and discuss it (Or rewrite it if I screw it up), etc. 68.39.174.238 (talk) 13:04, 13 January 2008 (UTC)
- Research and development page to create ?: I think that's is not a good idea to create now 3 pages (/Research and development; /Standards; /Standard new) when the first recommendation set up in the English Lab is not even finish. But... Action is better than words, so if you are able to manage them 3 [successfully] : go head, create them, edit them, etc. Yug 13:36, 13 January 2008 (UTC)
- I reject (To use your language) "Research and development". I intend "Standards" to be for the established standards, and "/New" for discussion (EG. If they existed, this discussion would be under /New, and when finalized would be summarized and placed under /Standards), however someone else went and created this page, so there's not much I can do about that. 68.39.174.238 (talk) 16:21, 13 January 2008 (UTC)
- Research and development page to create ?: I think that's is not a good idea to create now 3 pages (/Research and development; /Standards; /Standard new) when the first recommendation set up in the English Lab is not even finish. But... Action is better than words, so if you are able to manage them 3 [successfully] : go head, create them, edit them, etc. Yug 13:36, 13 January 2008 (UTC)
Summary: 1/ 8.39.174.238's proposat to organize the page "research and development" between "Standard" VS "New" ; 2/ 8.39.174.238's proposal to use the symbolic colors use by the parties themselves into our output SVG.
I'm busy writing my script to generate an SVG given a list of parties and their representation levels. I'm going to implement it as a cgi script and make the code available for improvement. As soon as I have a working copy, I will give the web address and post examples. Doing it in the evenings makes progress a bit slow, but it will probably be ready by Monday. --Slashme (talk) 10:38, 16 January 2008 (UTC)
I've now got a python script which draws a nice-looking array of squares, each "party" being represented by its own (random at the moment) colour. I'm still going to:
- Fix the scaling (at the moment it just draws the squares 50x50 with 10 space in between and doesn't worry about page size, so I'll make those lengths multiples of the page size, easy to do)
- Set a standard list of colours: Where do I get the list? Someone please mail me or drop a note on my talk page in case I miss any responses.
- Make it draw a legend at the bottom (will be easy)
- Give the option of circles as well as rectangles so that we can decide what looks better (really easy).
- Implement it as a CGI script on my freeshell account (not hard to do)
I have karate and Go this evening, but sometime this weekend I should have a working script for you all to test.--Slashme (talk) 10:06, 17 January 2008 (UTC)
- Thus far I've discovered Political colour, {{Party name with colour}} and Category:Political parties colours templates. 68.39.174.238 (talk) 15:55, 17 January 2008 (UTC)
Well, the Stellenbosch Go Club only starts meeting next week, so I got the script into a state where it writes OK pictures, but I'm not quite done yet: Please see User_talk:Slashme/parliament.py.
- Need to make circles as well
- Inkscape seems to mess up the file when I save as "plain svg"
- Need to convert to CGI and host on freeshell.org
Need to check out the standard colours
You can check out the source code at User:Slashme/parliament.py. Sorry, no comments yet!!
Here are some example images:
-
Demonstrating the balance of power in Wikipedia :-)
-
 Demonstrating that the script works OK with unicode (on Linux, anyway)

--Slashme (talk) 20:29, 17 January 2008 (UTC)
- HeHe, I'm unfortunately an RDer, despite the fact I'm such an absentee there. Makes me wonder what the upper house would look like; WP:AC, WP:ANI and WP:DEL?
Well, you will notice that my parliament was slightly biased, but yes, I think you have the House of Lords pretty well pegged X*D --Slashme (talk) 06:49, 18 January 2008 (UTC)
- Anyway, I suggest making the different blocs go from side to side and not top down.
Good point. I'll do that.--Slashme (talk) 06:49, 18 January 2008 (UTC)
- If you can, can you add the majority lines bit (EG. By asking "What majorities should be indicated?" and allowing people to enter fractions or #s of seats (Whichever is the easiest to implement in code))?
The majority lines are a good idea, but note that they will not be straight lines in general. But yes, not a big headache to code. Maybe this weekend. As for fractional seats, I think that will be easier to do by hand, but I'm open to convincing. What do you mean by #s? or was that a typo for %s?--Slashme (talk) 06:49, 18 January 2008 (UTC)
- I was just suggesting having the code ask what the majorities were, so when it generates the seats, it can then draw lines at, say 1/2 and 3/4 (Assuming those mean anything) to show which parties (If any) have the majority required to pass legislation and amend the constitution (or override a veto, or 'peach the president, or overthrow the government, etc, etc.). What I meant was possibly allowing people to enter "0.5" as well as 141 (seats) and having both be recognized, however it might be best to just pick the safest one to implement and add explainitory text to the question. 68.39.174.238 (talk) 16:52, 18 January 2008 (UTC)
- Oh, OK, now I understand. I'm not quite sure how the lines should work. There are at least two obvious possibilities – a step and a slice:
-
 33% slice of the US Senate
 -
 33% step of the US senate

.svg)
![[3]](https://en.wikipedia.org/wiki/Image:Sliderule.PickettN902T.agr.jpg)
- but only the step will work in general, because the slice depends on having a complete rectangle, which becomes difficult when you have (for example) 239 seats in your legislature. It seems pretty easy to code, except for collision avoidance, which I'll leave up to the user, so I'll do it some time in the next two weeks. --Slashme (talk) 14:06, 21 January 2008 (UTC)
- Why does the "slice" say that 30 is 1/3 of 100?! I do see what you're saying though, about the two methods, only why is the line divide the seats in fractions? 68.39.174.238 (talk) 18:08, 21 January 2008 (UTC)
- I've had another think about this. For a majority vote threshold you need a certain number of votes. For example in a legislature with 100 seats, you need 67 votes to pass a 2/3 majority motion. I won't be coding this weekend due to having a busy social calendar, but when I get around to it, I intend to allow specification of:
- Fractions (e.g. "2/3" or "1/2") or
- Number of seats (e.g. "67" or "50")
- I don't intend allowing percentages, because then too many people will type "66%" when they mean "67%".
- I've had another think about this. For a majority vote threshold you need a certain number of votes. For example in a legislature with 100 seats, you need 67 votes to pass a 2/3 majority motion. I won't be coding this weekend due to having a busy social calendar, but when I get around to it, I intend to allow specification of:
- I would prefer fractions, since that's how they are usually constitutionally specified, EG. "Two-thirds of both Houses concurring", not "67 here and 290 there", however allowing specific numbers may be useful for showing, EG. "Two-thirds were needed (One line), but only 117 voted for it". Also, do you think we should have specific colors for the lines for different purposes (EG. One color for a simple majority, another color set to mean "Majority to change the constitution", "majority to override vetoes", "Majority to impeach the executive", etc)? 68.39.174.238 (talk) 19:44, 23 January 2008 (UTC)
- OK, I think you have a point here; I'll stick to fractions and numbers for flexibility, though. I don't think different colours of lines are really necessary: This is not likely to become a standard, as there are so many possible variations on the theme. What I suggest is that I allow the user to specify a list of fractions and numbers, and I'll put a line in at each fraction or number given, with the label of the line being the fraction or number as given. If the user asks for too many lines, the diagram will look stupid, and they'll hopefully notice that. If the user wants different colours, that's really easy to do in inkscape (or even a text editor) afterwards. I suggest that I round all fractions upwards to the nearest integer, as that's the most logical sense to be made from the diagram. --Slashme (talk) 05:54, 24 January 2008 (UTC)
- Just remember to round up. 68.39.174.238 (talk) 17:54, 26 January 2008 (UTC)
- Also, why circles?
Just an alternative that was suggested above.--Slashme (talk) 06:49, 18 January 2008 (UTC)
- Anyway, thanx; this'll be the best thing ever when refined: we can create SVGs by the THOUSANDS... for EVERY LEGISLATURE... EVER. :DDDDD 68.39.174.238 (talk) 00:40, 18 January 2008 (UTC)
Thanks for the support! much appreciated. Everyone, please put bug reports and feature requests on User_talk:Slashme/parliament.py. --Slashme (talk) 06:49, 18 January 2008 (UTC)
Coalitions[edit]
A new idea: For legislatures where parties form superparties or blocks (Think Taiwan & their two coalitions), what would we do? I suggest having the parties in a block have their representatives squares bordered by the color of their coalition (EG. In the current Alaska Senate, we would have blue squares (Democrats), but the squares borders would be purple (Coalition). The uninvolved Republicans could be just red squares. 68.39.174.238 (talk) 21:18, 13 January 2008 (UTC)
- This is a good suggestion. I will add it to the "wishlist" section of User_talk:Slashme/parliament.py. --Slashme (talk) 12:49, 18 January 2008 (UTC)
Majortarian indications[edit]
I see someone's created some test-SVGs above. I suggest this addition: Lines to indicate the location of 1/2 and 2/3s (These being the Constitutionally specified majority and supermajority in Japan), similar to. 68.39.174.238 (talk) 21:18, 13 January 2008 (UTC)
- I agree. Not time now, but now planed.;] 210.203.61.15 (talk) 16:17, 14 January 2008 (UTC)
- Why? How hard is it to draw two lines in a SVG? 68.39.174.238 (talk) 19:34, 14 January 2008 (UTC)
- So : do it. I live in Taipei and It was 3:00 am when I posted this answer. As everyone, I need to sleep before to go to course on 9:00 am. yug 210.203.61.15 (talk) 19:34, 14 January 2008 (UTC)
- AHh, I see. I was thinking you meant "The standard is fixed and will have to be changed later", not "I don't have the time to change it now, but will do it later". Sorry. 68.39.174.238 (talk) 19:03, 15 January 2008 (UTC) PS. I can't modify images as an IP.
 Done for one [color : black + opacity=50%;], to display an example. I go to sleep. 210.203.61.15 (talk) 16:43, 16 January 2008 (UTC) <easy: install inksape , get an account on commons.>
- AHh, I see. I was thinking you meant "The standard is fixed and will have to be changed later", not "I don't have the time to change it now, but will do it later". Sorry. 68.39.174.238 (talk) 19:03, 15 January 2008 (UTC) PS. I can't modify images as an IP.
- So : do it. I live in Taipei and It was 3:00 am when I posted this answer. As everyone, I need to sleep before to go to course on 9:00 am. yug 210.203.61.15 (talk) 19:34, 14 January 2008 (UTC)
- Why? How hard is it to draw two lines in a SVG? 68.39.174.238 (talk) 19:34, 14 January 2008 (UTC)
- I suggest ditching the 1/3 mark: It has no meaning in the proceedings of the Japanese legislature. Similarly, if someone does the (Federal) Senate, we would need 50, 60, and 67, but not 33. 68.39.174.238 (talk) 15:45, 17 January 2008 (UTC)
- ditching=delete ? (I'm french... -___-") 210.203.61.15 (talk) 14:23, 19 January 2008 (UTC)
- Ditch (verb): to throw something out or discard it. See also on Wiktionary and in French. 68.39.174.238 (talk) 15:53, 19 January 2008 (UTC)
- ditching=delete ? (I'm french... -___-") 210.203.61.15 (talk) 14:23, 19 January 2008 (UTC)
Summary: Suggestion to add lines to indicated various majorities: 1/3 1/2 and 2/3 proposed. It was noted that these would have to be specified by the image creator as different legislatures have different working majorities.
Special sections[edit]
Another idea, which may or may not be useful: What about indicating separately special seats? Many countries have legislatures with a certain %age of seats allocated specifically for certain groups, EG. the new Montenegro Assembly has 5 seats for Albanians. Is there an easy and logical way to indicate these? Should we care (etc.)? 68.39.174.238 (talk) 04:17, 27 January 2008 (UTC)
- Very good point! In general, I assume there could be some parties which have seats in the reserved and non-reserved sections. How about allowing numbers in the form of "aRb" (e.g. 12R3) meaning that there are 12 seats of which three are reserved, and then all reserved seats are shown as circles in the party colour instead of squares? I will only be working on the script again after 14 Feb, as I have to prepare a talk on my M.Sc. work, so please discuss other suggestions in the meantime. --Slashme (talk) 06:45, 28 January 2008 (UTC)
- It depends: in some cases, the seats are competed for by totally different parties (EG. The ethnic ones), in others (EG. The ones requiring a certain % or number to be women), that may be fought over by all the parties. The last one though, makes be think of states in a federal affair: We would be drawing hundreds of lines to show the individuals state representation (EG. MA is all blue, but NJ has 7 and 8)! 68.39.174.238 (talk) 19:19, 28 January 2008 (UTC)
- Well, I guess we could leave the details to the user, maybe having different classes of seat be represented by different symbols. For example, the user could type:
Barking Mad Party:35,3(Women),2(Youth):#FFAAAA;Monster Raving Loony Party:0,3(Sith),4(Women):#d768c5;Very Silly Party:11,3(Jedi):#AAAAFF
and get a diagram with the Barking Mad Party having 35 pink squares, 3 pink circles and 2 mauve triangles, the Monster Raving Loony Party with 3 mauve pentagons and 4 mauve circles and the Very Silly Party with 11 powder-blue squares and 3 powder-blue crosses. The key would then show the parties each with a square in its colour, and also have a list with the symbols just given as transparent shapes with black outlines. If the list becomes unwieldy due to its length, I might have to code it as a few text boxes for each party with a button to add a party. This would be much more user-friendly. --Slashme (talk) 09:19, 29 January 2008 (UTC)
- I like the idea of a new UI (If possible). Feeding it a long string is probably the easiest way to parse, but it will get really unwieldy with things like Papua New Guinea. 68.39.174.238 (talk) 04:31, 30 January 2008 (UTC)
Script now hosted on freeshell.org[edit]
I have implemented:
- A title for the diagram
- Giving numbers of seats and percentages for the different parties in the key
- User selection of colours for parties
Go check out the script on my freeshell account, and please put bug reports and feature requests on User_talk:Slashme/parliament.py, and feel free to implement bug fixes and new features on User:Slashme/parliament.py, and drop me a line so that I can upload them. --Slashme (talk) 14:07, 20 January 2008 (UTC)
I still have to do:
- Majority lines
- Try what it looks like with circles instead of rectangles
- Put the date (either user-submitted or current date) in title
I still want to do:
- Use borders of blocks to indicate coalitions.
- Make the key in two columns if necessary
- Make the instructions and error messages at least borderline understandable.
- One (Offtopic) question: Why is the image there claim it was uploaded by "Special:Contributions" ? 68.39.174.238 (talk) 15:42, 20 January 2008 (UTC) PS. I'm off to test it now.
- As you correctly pointed out, the script was not working all of last night (South Africa night, that is ;-), but I fixed it this morning. As for the "Special:Contributions" thing, are you talking about Image:TestParlSVG3.svg? Every user has a "Special:Contributions" page, maybe you're seeing a link to mine? --Slashme (talk) 06:35, 21 January 2008 (UTC)
- No, it claimed that the uploader was "Special:Contributions", however it appears that that was a server error and has been fixed. 68.39.174.238 (talk) 21:20, 22 January 2008 (UTC)
[edit]
I see I have to upgrade my membership at freeshell to get continued use of the cgi facilities. This isn't very expensive, but I will only get around to it in a few days. Until then, the script is unavailable. Sorry!! --Slashme (talk) 05:28, 20 February 2008 (UTC)
- OK, now the script is again available: See User:Slashme#Parliament_diagram_tool. There are now two scripts, one for semicircular diagrams, one for rectangles. --Slashme (talk) 09:04, 29 May 2010 (UTC)
Other solution : Website making SVG pie charts ![edit]
- Other solution !!! On the web is probably websites in which we can input % , and who output nice + accurate PNG or SVG circle pie chart !!! Did you know one ?? Yug 18:25, 12 January 2008 (UTC)
- I need an english speaker, my english is not enough to fully understand things like : Creating SVG Pie Charts through XSLT via a Web Service. I have to stop here my involvement since my coding and english abilities are clearly not enough. You can have a look at google query Pie+Chart+SVG, here is probably a website providing such creation. If you find one, even better : if it is under free licence, then we will be able to ask on http://bugzilla.wikimedia.org to create for us a page to create [semi-]circle pie charts according to our standards !!! So : your eyes are really welcome to find a such website !! Yug 18:55, 12 January 2008 (UTC)
- I finally made a request to the gods... we will see what they say. —Preceding unsigned comment added by 210.203.61.15 (talk) 19:22, 12 January 2008 (UTC)
- I need an english speaker, my english is not enough to fully understand things like : Creating SVG Pie Charts through XSLT via a Web Service. I have to stop here my involvement since my coding and english abilities are clearly not enough. You can have a look at google query Pie+Chart+SVG, here is probably a website providing such creation. If you find one, even better : if it is under free licence, then we will be able to ask on http://bugzilla.wikimedia.org to create for us a page to create [semi-]circle pie charts according to our standards !!! So : your eyes are really welcome to find a such website !! Yug 18:55, 12 January 2008 (UTC)
- Create A Graph. Free online graph creation tool at the NCES website. Bar charts, Line charts, Area charts, Pie charts, and XY graphs. Choice of PDF, PNG, JPG, EMF, EPS, and SVG output.
- For more charting tools, see the resources section at commons:Category:Charts. --Timeshifter (talk) 17:45, 20 January 2008 (UTC)
- Holiday 2015 present, a pie-chart creating with Extension:Graph using Vega version 2 specification:
- For more charting tools, see the resources section at commons:Category:Charts. --Timeshifter (talk) 17:45, 20 January 2008 (UTC)
| Graphs are unavailable due to technical issues. There is more info on Phabricator and on MediaWiki.org. |
Happy baking pies! Ad Huikeshoven (talk) 21:26, 23 December 2015 (UTC)
Archivery[edit]
Not really a graphics standard, but about archiving this page. Collapsing sections and summarizing them (When useful or finished) is OK, but after a while we'll need to actually archive something. As such, I propose that 3 or 4 days after a standard is finalized (Moved to the standards page), all the discussion relating to it (Unless it's turned into something else) be sent to an /Archive. 68.39.174.238 (talk) 16:08, 19 January 2008 (UTC)