
Wikipedia:WikiProject Maps/Conventions/Area maps
| This Wikipedia page needs to be updated. The reason given is: Now Locator maps are used for this (for Locator maps (blank) see Location maps), there is even no Commons: Category:Area maps!. Please help update this Wikipedia page to reflect recent events or newly available information. Relevant discussion may be found on the talk page. |
This page provides conventions for wiki Area maps.
Area maps or distribution maps display one or multiple entities on a map, and are closely link to Locator maps (blank) (mother) providing the background & Historical maps (daughter) providing conventions for associated labels, icons, and legend. Historical label/icons conventions may also be used for other purpose, such as complex biology maps, etc. The conventions of this page apply to areas. For further icons and legend conventions, see Historical maps conventions.
These conventions for Area maps are often used to create basic Locator maps, or to display areas of control by respective kingdoms/countries, plus some key points, and are actually the basis of more complex maps. You need these conventions when you start an explicative historical map. If you use these conventions to complete background such as topographic ones, apply a transparency of 30%.
Specific area maps[edit]
Locator maps/Single-area maps display an article's subject area of occupation in a larger context. These maps are often used to display: a country (red) in its region (map) and in the world (corner map); an animal range (red) in its context (country map, world map); language (red), people, kingdom in their wider context.
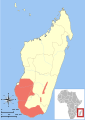
If the area of interest (subject) is a really small part of the map, generally <10~20% of the landmass —the most common—, we have to use the red below to clearly highlight this small area. If the area of interest is relatively wide, you are encouraged to use softer colors, some are suggested below.
Multi-areas maps/Complex maps display several areas of interest.
Semantic maps/Complex maps display one or several areas of interest, and may include icons, labels, legend, and a localizator (a small locator map). Being specifically complex, please see Historical maps.
Convention[edit]
- Note: the Four color theorem states that if each area is contiguous (one element), four colours are enough to create the whole map, regardless of the area. Labels have to be used for these four color maps.
- Note: As much as possible, we back up our color choices with academic expertise in the field. See ColorBrewer & Cynthia Brewer.
| Subject | Colorimetry (RGB/hex) |
|---|---|
| Point of interest (cities especially). | #B00000
R:176 G:0 B:0 |
| Area of interest (species range, etc). | #F07568
R:240 G:117 B:104 |
| Border colour for areas of interest. | #E0584E
R:224 G:88 B:78 |
| Parks or natural preservation areas. | #A0F090
R:160 G:240 B:144 |
| Maps with opposite groups[1] | |
| Color n⁰1, opacity 100 or 40%: | #e41a1c
R:228 G:26 B:28 |
| Color n⁰2, opacity 100 or 40%: | #4daf4a
R:77 G:175 B:74 |
| Color n⁰3, opacity 100 or 40%: | #984ea3
R:152 G:78 B:163 |
| Color n⁰4, opacity 100 or 40%: | #ff7f00
R:255 G:127 B:0 |
| Color n⁰5, opacity 100 or 40% (/!\ may conflict with water bodies): | #377eb8
R:55 G:126 B:184 |
| Color n⁰6, opacity 100 or 40%: | #ffff33
R:255 G:255 B:51 |
| Color n⁰7, opacity 100 or 40%: | #a65628
R:166 G:86 B:40 |
| Color for bird distribution map | |
| Year-round. | #adafd8
R:173 G:175 B:216 |
| Breeding areas. | #f5ae8c
R:245 G:174 B:140 |
| Migration or migratory areas. | #f7e983
R:247 G:233 B:131 |
| Non-breeding areas. | #9dcce9
R:157 G:204 B:233 |
| Introduced areas. | #ff7f00
R:255 G:127 B:0 |
|
Naming (upload):
For species, use the binominal name. For others, use the English wiki article title. If needed, add just after the subject name the section's name, the year, etc.
| |
Template[edit]
=> No SVG template available yet.
How to create[edit]
Below are easy-to-follow instructions for how to create a PNG distribution map like those often seen in species article taxoboxes.
Photoshop instructions[edit]
Note: This only works for land distribution maps, not ocean distribution maps.
- Download BlankMap-World6,_compact.svg rendered as a 1000px PNG file. You can try using this direct link, although the URL may change at some point.
- Open the PNG file in Photoshop.
- Choose any of the selection tools. Make sure you have the "anti-alias" option checked for the tool you have selected. Select the area you want to highlight on the map. Don't worry if you also have areas of ocean selected.
- Go to the Edit menu and choose Copy and then Paste. This should create a new layer which includes a copy of the area you selected.
- Go to the Image menu and choose Mode > RGB Color.
- Go to the Image menu and choose Adjustments > Curves.
- Drag the handle in the lower left-hand corner of the histogram to the right until the Input reading is "160" and the output reading is "0". Click OK.
- Go to the Image menu and choose Adjustments > Hue/Saturation.
- Check the Colorize check box. Set the Hue to 120, the Saturation to 100, and the Lightness to 32. Click OK.
- Go to the Layer menu and choose Flatten Image.
- Save the image as a new PNG file and upload to Commons.
GIMP instructions[edit]
- Download the PNG file as described above and open it with GIMP.
- Choose any of the selection tools. As in Photoshop, make sure you have the "anti-alias" option checked for the tool you have selected. Select the area you want to highlight on the map. Don't worry if you also have areas of ocean selected.
- Go to the Edit menu and choose Copy and then Paste. Then go to "layers" and select "new layer". This should create a new layer which includes a copy of the area you selected. Alternatively, you can create a new layer before choosing Paste.
- Go to the Colors menu and choose Curves.
- Drag the handle in the lower left-hand corner of the histogram to the right until the x is something between "160" and "200" (depending on how dark you want the selected area to appear) and the y is "0". Click OK.
- Go to the Colors menu and choose Colorize.
- Choose your color by adjusting the "Hue" and "Saturation". For a bright red, choose Hue to be 0 and the Saturation to be 100. Click OK.
- Go to the Layer menu and choose Merge.
- Save the image as a new PNG file and upload to Commons.
Inkscape instructions[edit]
- Choose one of the blank SVG maps commons:Category:SVG blank maps of the world
- Use the bezier line tool and draw a closed area that represents the distribution on top of the map. You do not need to be accurate once you cross the land boundaries.
- Select the bezier shape and the underlying land shape (hold shift down while using the mouse to select two objects) - run the intersection tool from the "Path" menu
- The intersection region is a distribution range - copy this to clipboard
- Undo the intersection action and remove the bezier shape
- Use paste-in-place to get the region of interest over the map - change its colour appropriately
- Repeat actions as needed - use the text tool to add any annotations
- When overlapping distributions need to be shown it helps to set the Alpha (transparency) of the colour to a lower value so that the colours of the distribution ranges mix
Application[edit]
Once you have uploaded the map to Commons, be sure to add it to the appropriate subcategory. For the distribution map of a species, consider adding it to Animal distribution maps, Flora distribution maps, Fungi distribution maps, etc..
To add the map into a taxobox, edit the range_map and range_map_width parameters of the {{taxobox}} template in the article. For example:
| range_map = Distribution.zygoballus.sexpunctatus.1.png
| range_map_width = 250px
Gallery of examples[edit]
| This Wikipedia page needs to be updated. Please help update this Wikipedia page to reflect recent events or newly available information. Relevant discussion may be found on the talk page. (September 2023) |
- Locator (filled)
-
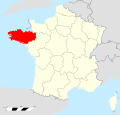 Using "Location maps conventions" + the area coloration (red).
 -
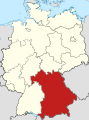 Using "Location maps conventions" + the area coloration (red).
 -
 India Andhra Pradesh locator map (SVG)
 -
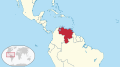 Venezuela in its region.svg
 -
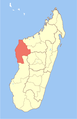 If based on English PNG conventions
 -
 if based on English SVG conventions
 -
 if based on German-French conventions
 -
 SVG
SVG -
 SVG
SVG


.svg)


See also[edit]
Map conventions and Map Project | |||
|---|---|---|---|
 | Conventions set |  | |
| Drafts | |||
| Others |
| ||
References[edit]
- ^ Source: http://colorbrewer2.org > Qualitative scale > Set 1