
Wiltshire Council elections
As a result of the 2009 structural changes to local government in England, the former Wiltshire County Council and the four districts within its geographical area were replaced by the new Wiltshire Council, which is a unitary authority covering the same area, with elections continuing to be held every four years, beginning in June 2009. Previously, Wiltshire County Council had been elected between 1889 and 2005, initially every three years, later every four years.
History
The county council was established in 1889 as the principal local authority for the historic county of Wiltshire. It continued as such until April 1997, when the borough of Swindon became a unitary authority, taking almost a third of the population out of the area then falling under Wiltshire County Council. From 2009, it became Wiltshire Council.
Election results
Wiltshire County Council
- 5 May 1977: the Conservatives held onto control, winning fifty-seven seats, a gain of seventeen. Labour won fourteen, the Liberals and Independents four each.[1]
- 7 May 1981: following boundary changes, the Conservatives again retained control, winning forty seats, Labour had twenty, the Liberals twelve, and Independents two, including one Ratepayer.[2]
- 2 May 1985: the Conservatives lost their majority, winning only thirty seats, resulting in no overall control. The Liberals took seventeen seats and their Social Democrat allies eight, Labour seventeen, plus three Independents, including one Ratepayer.[3] Following the elections, an agreement between the leader of the Liberals, Jack Ainslie, and the leader of the Labour members, Mary Salisbury, led to the formation of a minority SDP–Liberal Alliance administration.[4]
- 4 May 1989: Conservatives 35, Liberal Democrats 18, Labour 18, Independents 2, Liberal 1, SDP 1, resulting in a continuation of no overall control, this time with the Liberal Democrats and Labour forming a joint administration.
- 6 May 1993: Liberal Democrats 33, Conservatives 18, Labour 17, resulting in a further four years of no overall control, with a Liberal Democrat and Labour administration.
- On 1 April 1997, Swindon was separated from Wiltshire to become a new unitary authority, giving the Liberal Democrats a brief period of overall control before that year's election.
- 1 May 1997 (the same day as the general election of 1997): Conservatives 22, Liberal Democrats 20, Labour 4, Independent 1, resulting in a continuation of no overall control, with a new Liberal Democrat and Labour administration being formed.
- On 2 April 1998 the Conservatives won a by-election in the Whorwellsdown division by 17 votes, and at the annual meeting in May 1998 a Conservative and Independent administration was formed.
- On 13 January 2000, the Conservatives won another by-election, this time in Melksham Without, gaining an overall majority which they were able to hold until the following year's elections.
- 7 June 2001 (a later date than usual to coincide with the general election of 2001): Conservatives 28, Liberal Democrats 14, Labour 3, Independents 2.
- 5 May 2005 (again coinciding with a general election): Conservatives 28, Liberal Democrats 16, Labour 3, Independents 2. Wiltshire County Council came to an end on 1 April 2009, when a new Wiltshire Council unitary authority was formed.
Wiltshire Council
- 4 June 2009 (coinciding with European Parliament elections): Conservatives 62, Liberal Democrats 24, Independents 7, Devizes Guardians 3, Labour 2.
- 2 May 2013: Conservatives 58, Liberal Democrats 27, Independents 8, Labour 4, UK Independence Party 1.
Council elections
County Council elections
- Wiltshire County Council election, 1977
- Wiltshire County Council election, 1981
- Wiltshire County Council election, 1985
- Wiltshire County Council election, 1989
- Wiltshire County Council election, 1993
- Wiltshire County Council election, 1997
- Wiltshire County Council election, 2001
- Wiltshire County Council election, 2005
Unitary authority elections
County result maps
-
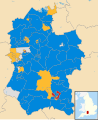 2013 results map

By-election results
1997–2001
| Party | Candidate | Votes | % | ±% | |
|---|---|---|---|---|---|
| Conservative | Joan Barbara Prouse Savage | 1,095 | 50.4 | +12.0 | |
| Liberal Democrats | Trevor William Carbin | 1,078 | 49.6 | +2.4 | |
| Majority | 17 | 0.8 | |||
| Turnout | 2173 | 34.6 | |||
| Conservative gain from Liberal Democrats | Swing | ||||
| Party | Candidate | Votes | % | ±% | |
|---|---|---|---|---|---|
| Conservative | Gerard Downes | 1,223 | 60.6 | ||
| Liberal Democrats | Gillian Morgan | 682 | 33.8 | ||
| Labour | Mark Wareham | 114 | 5.6 | ||
| Majority | 541 | 26.8 | |||
| Turnout | 2,019 | 30.35 | |||
| Conservative hold | Swing | ||||
| Party | Candidate | Votes | % | ±% | |
|---|---|---|---|---|---|
| Conservative | William Arthur Spiers | 810 | 48.6 | +15.1 | |
| Liberal Democrats | Angela Betty Barker | 623 | 37.4 | -1.2 | |
| Labour | Marcus Aurelius | 234 | 14.0 | -11.4 | |
| Majority | 187 | 11.2 | |||
| Turnout | 1,667 | 18.4 | |||
| Conservative gain from Liberal Democrats | Swing | ||||
| Party | Candidate | Votes | % | ±% | |
|---|---|---|---|---|---|
| Conservative | David Lay | 1,470 | 61.8 | +22.1 | |
| Liberal Democrats | Graham Francis | 771 | 32.4 | -13.1 | |
| Labour | Terrence O'Sullivan | 139 | 5.8 | -8.9 | |
| Majority | 699 | 29.4 | |||
| Turnout | 2,380 | 29.4 | |||
| Conservative hold | Swing | ||||
2001–2005
| Party | Candidate | Votes | % | ±% | |
|---|---|---|---|---|---|
| Labour | Clive Robert Vincent | 534 | 36.8 | -14.8 | |
| Conservative | Terence John Lindley | 288 | 19.8 | -6.2 | |
| Liberal Democrats | Ben Gerald Rawlence | 272 | 18.7 | -0.1 | |
| Independent | Stephen Michael Dauwalder | 252 | 17.4 | +17.4 | |
| UKIP | Derek William Sales | 56 | 3.8 | +3.8 | |
| Green | Susan Isabel Wright | 50 | 3.4 | -0.3 | |
| Majority | 246 | 17.0 | |||
| Turnout | 1,482 | 24.3 | |||
| Labour hold | Swing | ||||
| Party | Candidate | Votes | % | ±% | |
|---|---|---|---|---|---|
| Liberal Democrats | Paul Jonathan Fox | 1,052 | 57.0 | +17.5 | |
| Conservative | Adrian Robin Nicholas Fry | 488 | 26.4 | -2.7 | |
| Labour | Maureen Frances Lloyd | 307 | 16.6 | -14.8 | |
| Majority | 564 | 30.6 | |||
| Turnout | 1,847 | 29.5 | |||
| Liberal Democrats hold | Swing | ||||
2005–2009
| Party | Candidate | Votes | % | ±% | |
|---|---|---|---|---|---|
| Liberal Democrats | Paul Batchelor | 548 | 40.2 | +11.1 | |
| Conservative | Christopher March | 543 | 39.8 | +4.4 | |
| Independent | Michael John Turner | 273 | 20.0 | -15.5 | |
| Majority | 5 | 0.4 | |||
| Turnout | 1,364 | 21.3 | |||
| Liberal Democrats gain from Independent | Swing | ||||
| Party | Candidate | Votes | % | ±% | |
|---|---|---|---|---|---|
| Conservative | Peter Fuller | 1,363 | 49.2 | +17.4 | |
| Liberal Democrats | Tom James | 1,176 | 42.5 | -7.5 | |
| Green | David McQueen | 229 | 8.3 | +8.3 | |
| Majority | 187 | 6.7 | |||
| Turnout | 2,768 | 19.2 | |||
| Conservative gain from Liberal Democrats | Swing | ||||
| Party | Candidate | Votes | % | ±% | |
|---|---|---|---|---|---|
| Independent | Ernie Clark | 1,075 | 41.0 | +6.7 | |
| Liberal Democrats | Trevor Carbin | 994 | 37.9 | -0.1 | |
| Conservative | Andy Milton | 458 | 17.4 | -10.2 | |
| Labour | Louise Smith | 53 | 2.0 | +2.0 | |
| Green | Hilary Millichamp | 45 | 1.7 | +1.7 | |
| Majority | 81 | 3.1 | |||
| Turnout | 2,625 | 37.0 | |||
| Independent gain from Liberal Democrats | Swing | ||||
2009–2013
| Party | Candidate | Votes | % | ±% | |
|---|---|---|---|---|---|
| Independent | Francis Morland | 385 | 37.1 | + 37.1 | |
| Liberal Democrats | Gordon Ian King | 315 | 30.3 | -8.4 | |
| Conservative | David Edward Halik | 273 | 26.3 | -33.6 | |
| UKIP | Benjamin Anthony Parker | 61 | 5.9 | + 5.9 | |
| Majority | 70 | ||||
| Turnout | 1,034 | 30.66 | |||
| Independent gain from Conservative | Swing | +35.3 | |||
| Party | Candidate | Votes | % | ±% | |
|---|---|---|---|---|---|
| Conservative | Liz Bryant | 561 | 53.5 | +10.3 | |
| Liberal Democrats | Paul Mortimer | 358 | 34.2 | +15.9 | |
| Labour | Andrew Derek Peter Jones | 74 | 7.06 | +2.3 | |
| Independent | Pat Bryant | 55 | 5.3 | N/A | |
| Majority | 203 | ||||
| Turnout | 1052 | 27.1 | -17.7 | ||
| Conservative hold | Swing | -2.8 | |||
2013–2016
| Party | Candidate | Votes | % | ±% | |
|---|---|---|---|---|---|
| Conservative | Jeremy Paul Wickham | 480 | 35.6 | ||
| Liberal Democrats | Carolyn Rose King | 372 | 27.6 | ||
| UKIP | Roderick Paul Eaton | 236 | 17.5 | ||
| Independent | Francis Morland | 192 | 14.2 | ||
| Labour | Shaun Samuel James Henley | 69 | 5.1 | ||
| Majority | 203 | ||||
| Turnout | 1,349 | 37.3 | |||
| Conservative hold | Swing | ||||
| Party | Candidate | Votes | % | ±% | |
|---|---|---|---|---|---|
| Conservative | Anna Louise Cuthbert | 1,641 | 56.7 | + 1.2 | |
| UKIP | Paul Robert Carter | 519 | 17.9 | - 26.6 | |
| Liberal Democrats | Alan Charles Rankin | 401 | 13.8 | + 13.8 | |
| Labour | David Wearn | 334 | 11.5 | + 11.5 | |
| Majority | 1,122 | ||||
| Turnout | 2,916 | 74.5 | |||
| Conservative hold | Swing | ||||
| Party | Candidate | Votes | % | ±% | |
|---|---|---|---|---|---|
| Conservative | Melody Rhonda Thompson | 1,154 | 47.4 | ||
| Liberal Democrats | Michael Kenneth Brough | 864 | 35.5 | ||
| Green | Tina Maria Johnston | 416 | 17.1 | ||
| Majority | 290 | ||||
| Turnout | 2,456 | 74.3 | |||
| Conservative gain from Liberal Democrats | Swing | ||||
| Party | Candidate | Votes | % | ±% | |
|---|---|---|---|---|---|
| Conservative | Atiqul Hoque | 425 | 36.7 | +13.7 | |
| Liberal Democrats | Greg Condliffe | 242 | 20.9 | -22.1 | |
| Labour | Mark Frank Timbrell | 232 | 20.0 | +5.5 | |
| Green | Michael Robert Pope | 215 | 18.6 | +11.1 | |
| Independent | Diana Dallimore | 45 | 3.9 | ||
| Majority | 290 | ||||
| Turnout | 1,163 | 31.9 | |||
| Conservative gain from Liberal Democrats | Swing | ||||
| Party | Candidate | Votes | % | ±% | |
|---|---|---|---|---|---|
| Liberal Democrats | Jamie Paul Capp | 361 | 25.7 % | ||
| Conservative | Robert Alexander Yuill | 355 | 25.3 % | ||
| Independent | Andy Derry | 292 | 20.0 % | ||
| UKIP | Les Webster | 217 | 15.5 % | ||
| Labour | Steve McAuliffe | 133 | 9.5 % | ||
| Green | Joshua Baker | 60 | 4.2 % | ||
| Majority | 5 | ||||
| Turnout | |||||
| Liberal Democrats gain from Conservative | Swing | ||||
References
- ^ Conservatives triumph in Greater London and metropolitan counties in The Times of London, issue 59997 dated 7 May 1977, p. 3
- ^ 'Declarations from the county councils' in The Times of London, issue 60923 dated Saturday, 9 May 1981, p. 4
- ^ Hugh Clayton (Local Government Correspondent), 'Local Elections' in The Times of London, issue 62129 dated 4 May 1985, p. 4
- ^ Hugh Clayton (Local Government Correspondent), 'Emerging figure in new Lib-Lab pact: an Alliance shire leader cast in Tory mould', in The Times of London, issue 62135 dated 11 May 1985, p. 2
- ^ "Salisbury St Paul By Election result". Wiltshire Council. 15 November 2002. Retrieved 2 September 2009.
{{cite web}}: Italic or bold markup not allowed in:|publisher=(help) [dead link] - ^ "Chippenham Sheldon by-election result". Wiltshire Council. 27 February 2004. Retrieved 2 September 2009.
{{cite web}}: Italic or bold markup not allowed in:|publisher=(help) [dead link] - ^ "New councillors for Warminster ward". Wiltshire Times. 10 November 2006. Retrieved 2 September 2009.
{{cite web}}: Italic or bold markup not allowed in:|publisher=(help) - ^ a b "Local Authority Byelection Results - February 2008". www.gwydir.demon.co.uk. Retrieved 19 November 2010.
- ^ "Id: 88010 - Friday 4th September 2009 - Press Release by election results". Wiltshire Council. 8 February 2008. Retrieved 2 September 2009.
{{cite web}}: Italic or bold markup not allowed in:|publisher=(help) - ^ http://www.wiltshire.gov.uk/elections-declation-of-result-bromham-rowde-potterne.pdf
- ^ Ethandune result at wiltshire.gov.uk/elections, accessed 19 July 2014
- ^ by-election result at wiltshire.gov.uk, accessed 10 May 2015
