
Spectrogram: Difference between revisions
Added speech recognition use case to applications section. |
Filled in 13 bare reference(s) with reFill () |
||
| Line 9: | Line 9: | ||
==Format== |
==Format== |
||
A common format is a graph with two geometric dimensions: one axis represents [[time]] or [[RPM]],<ref>https://community.plm.automation.siemens.com/t5/Testing-Knowledge-Base/What-s-an-Order/ta-p/355020</ref>{{fv|reason=No mention of "Spectrogram" in source.|date=November 2017}} the other axis is [[frequency]]; a third dimension indicating the [[amplitude]] of a particular frequency at a particular time is represented by the [[Brightness|intensity]] or color of each point in the image. |
A common format is a graph with two geometric dimensions: one axis represents [[time]] or [[RPM]],<ref>{{cite web|url=https://community.plm.automation.siemens.com/t5/Testing-Knowledge-Base/What-s-an-Order/ta-p/355020|title=What's an Order?|author=|date=11 July 2016|website=siemens.com|accessdate=7 April 2018}}</ref>{{fv|reason=No mention of "Spectrogram" in source.|date=November 2017}} the other axis is [[frequency]]; a third dimension indicating the [[amplitude]] of a particular frequency at a particular time is represented by the [[Brightness|intensity]] or color of each point in the image. |
||
There are many variations of format: sometimes the vertical and horizontal axes are switched, so time runs up and down; sometimes the amplitude is represented as the height of a 3D surface instead of color or intensity. The frequency and amplitude axes can be either [[linear]] or [[logarithm]]ic, depending on what the graph is being used for. Audio would usually be represented with a logarithmic amplitude axis (probably in [[decibel]]s, or dB), and frequency would be linear to emphasize harmonic relationships, or logarithmic to emphasize musical, tonal relationships. |
There are many variations of format: sometimes the vertical and horizontal axes are switched, so time runs up and down; sometimes the amplitude is represented as the height of a 3D surface instead of color or intensity. The frequency and amplitude axes can be either [[linear]] or [[logarithm]]ic, depending on what the graph is being used for. Audio would usually be represented with a logarithmic amplitude axis (probably in [[decibel]]s, or dB), and frequency would be linear to emphasize harmonic relationships, or logarithmic to emphasize musical, tonal relationships. |
||
| Line 33: | Line 33: | ||
Spectrograms may created from a [[time-domain]] signal in one of two ways: approximated as a filterbank that results from a series of [[band-pass filter]]s (this was the only way before the advent of modern digital signal processing), or calculated from the time signal using the [[Fourier transform]]. These two methods actually form two different [[time–frequency representation]]s, but are equivalent under some conditions. |
Spectrograms may created from a [[time-domain]] signal in one of two ways: approximated as a filterbank that results from a series of [[band-pass filter]]s (this was the only way before the advent of modern digital signal processing), or calculated from the time signal using the [[Fourier transform]]. These two methods actually form two different [[time–frequency representation]]s, but are equivalent under some conditions. |
||
The bandpass filters method usually uses [[analog signal|analog]] processing to divide the input signal into frequency bands; the magnitude of each filter's output controls a transducer that records the spectrogram as an image on paper.<ref> |
The bandpass filters method usually uses [[analog signal|analog]] processing to divide the input signal into frequency bands; the magnitude of each filter's output controls a transducer that records the spectrogram as an image on paper.<ref>{{cite web|url=https://www.sfu.ca/sonic-studio/handbook/Spectrograph.html|title=Spectrograph|author=|date=|website=www.sfu.ca|accessdate=7 April 2018}}</ref> |
||
Creating a spectrogram using the FFT is a [[Digital signal processing|digital process]]. Digitally [[sampling (signal processing)|sampled]] data, in the [[Time series|time domain]], is broken up into chunks, which usually overlap, and Fourier transformed to calculate the magnitude of the frequency spectrum for each chunk. Each chunk then corresponds to a vertical line in the image; a measurement of magnitude versus frequency for a specific moment in time (the midpoint of the chunk). These spectrums or time plots are then "laid side by side" to form the image or a three-dimensional surface,<ref> |
Creating a spectrogram using the FFT is a [[Digital signal processing|digital process]]. Digitally [[sampling (signal processing)|sampled]] data, in the [[Time series|time domain]], is broken up into chunks, which usually overlap, and Fourier transformed to calculate the magnitude of the frequency spectrum for each chunk. Each chunk then corresponds to a vertical line in the image; a measurement of magnitude versus frequency for a specific moment in time (the midpoint of the chunk). These spectrums or time plots are then "laid side by side" to form the image or a three-dimensional surface,<ref>{{cite web|url=https://ccrma.stanford.edu/~jos/mdft/Spectrograms.html|title=Spectrograms|author=|date=|website=ccrma.stanford.edu|accessdate=7 April 2018}}</ref> or slightly overlapped in various ways, i.e. [[Window function#Overlapping windows|windowing]]. This process essentially corresponds to computing the squared [[magnitude (mathematics)|magnitude]] of the [[short-time Fourier transform]] (STFT) of the signal <math>s(t)</math> — that is, for a window width <math>\omega</math>, <math>\mathrm{spectrogram}(t,\omega)=\left|\mathrm{STFT}(t,\omega)\right|^2</math>.<ref>{{cite web|url=http://zone.ni.com/reference/en-XX/help/371361E-01/lvanls/stft_spectrogram_core/#details|title=STFT Spectrograms VI |
||
- NI LabVIEW 8.6 Help|author=|date=|website=zone.ni.com|accessdate=7 April 2018}}</ref> |
|||
==Applications== |
==Applications== |
||
* Early analog spectrograms were applied to a wide range of areas including the study of bird calls (such as that of the [[great tit]]), with current research continuing using modern digital equipment<ref> |
* Early analog spectrograms were applied to a wide range of areas including the study of bird calls (such as that of the [[great tit]]), with current research continuing using modern digital equipment<ref>{{cite web|url=http://www.birdsongs.it/index.asp|title=BIRD SONGS AND CALLS WITH SPECTROGRAMS ( SONOGRAMS ) OF SOUTHERN TUSCANY ( Toscana - Italy )|author=|date=|website=www.birdsongs.it|accessdate=7 April 2018}}</ref> and applied to all animal sounds. Contemporary use of the digital spectrogram is especially useful for studying [[frequency modulation]] (FM) in animal calls. Specifically, the distinguishing characteristics of FM chirps, broadband clicks, and social harmonizing are most easily visualized with the spectrogram. |
||
* Spectrograms are useful in assisting in overcoming speech deficits and in speech training for the portion of the population that is profoundly [[hearing impairment|deaf]]<ref> |
* Spectrograms are useful in assisting in overcoming speech deficits and in speech training for the portion of the population that is profoundly [[hearing impairment|deaf]]<ref>{{cite journal|url=https://link.springer.com/article/10.1007/BF02222144|title=A wearable tactile sensory aid for profoundly deaf children|first1=Frank A.|last1=Saunders|first2=William A.|last2=Hill|first3=Barbara|last3=Franklin|date=1 December 1981|publisher=|journal=Journal of Medical Systems|volume=5|issue=4|pages=265–270|accessdate=7 April 2018|via=link.springer.com|doi=10.1007/BF02222144}}</ref> |
||
* The studies of [[phonetics]] and [[speech synthesis]] are often facilitated through the use of spectrograms.<ref> |
* The studies of [[phonetics]] and [[speech synthesis]] are often facilitated through the use of spectrograms.<ref>{{cite web|url=http://cslu.cse.ogi.edu/tutordemos/SpectrogramReading/spectrogram_reading.html|title=Spectrogram Reading|author=|date=|website=ogi.edu|accessdate=7 April 2018}}</ref><ref>{{cite web|url=http://www.fon.hum.uva.nl/praat/|title=Praat: doing Phonetics by Computer|author=|date=|website=www.fon.hum.uva.nl|accessdate=7 April 2018}}</ref> |
||
* By reversing the process of producing a spectrogram, it is possible to create a signal whose spectrogram is an arbitrary image. This technique can be used to hide a picture in a piece of audio and has been employed by several [[electronic music]] artists.<ref> |
* By reversing the process of producing a spectrogram, it is possible to create a signal whose spectrogram is an arbitrary image. This technique can be used to hide a picture in a piece of audio and has been employed by several [[electronic music]] artists.<ref>{{cite web|url=http://www.bastwood.com/aphex.php|title=The Aphex Face - bastwood|author=|date=|website=www.bastwood.com|accessdate=7 April 2018}}</ref> See also [[steganography]]. |
||
* Some modern music is created using spectrograms as an intermediate medium; changing the intensity of different frequencies over time, or even creating new ones, by drawing them and then inverse transforming. See [[Audio timescale-pitch modification]] and [[Phase vocoder]]. |
* Some modern music is created using spectrograms as an intermediate medium; changing the intensity of different frequencies over time, or even creating new ones, by drawing them and then inverse transforming. See [[Audio timescale-pitch modification]] and [[Phase vocoder]]. |
||
* Spectrograms can be used to analyze the results of passing a test signal through a signal processor such as a filter in order to check its performance.<ref> |
* Spectrograms can be used to analyze the results of passing a test signal through a signal processor such as a filter in order to check its performance.<ref>{{cite web|url=http://src.infinitewave.ca|title=SRC Comparisons|author=|date=|website=src.infinitewave.ca|accessdate=7 April 2018}}</ref> |
||
* High definition spectrograms are used in the development of RF and microwave systems<ref> |
* High definition spectrograms are used in the development of RF and microwave systems<ref>{{cite web|url=http://www.constantwave.com/gallery.aspx|title=constantwave.com - constantwave Resources and Information.|author=|date=|website=www.constantwave.com|accessdate=7 April 2018}}</ref> |
||
* Spectrograms are now used to display [[scattering parameters]] measured with vector network analyzers<ref>{{cite web |url=http://www.constantwave.com/spectro_vna.aspx |title=Spectrograms for vector network analyzers |archive-url=https://web.archive.org/web/20120810020043/http://www.constantwave.com/spectro_vna.aspx |archive-date=2012-08-10 |deadurl=yes |df= }}</ref> |
* Spectrograms are now used to display [[scattering parameters]] measured with vector network analyzers<ref>{{cite web |url=http://www.constantwave.com/spectro_vna.aspx |title=Spectrograms for vector network analyzers |archive-url=https://web.archive.org/web/20120810020043/http://www.constantwave.com/spectro_vna.aspx |archive-date=2012-08-10 |deadurl=yes |df= }}</ref> |
||
* The [[United States Geological Survey|US Geological Survey]] now provides real-time spectrogram displays from seismic stations<ref> |
* The [[United States Geological Survey|US Geological Survey]] now provides real-time spectrogram displays from seismic stations<ref>{{cite web|url=https://earthquake.usgs.gov/monitoring/spectrograms/24hr/|title=Real-time Spectrogram Displays|author=|date=|website=earthquake.usgs.gov|accessdate=7 April 2018}}</ref> |
||
* Spectrograms can be used with [[Recurrent neural network|recurrent neural networks]] for speech recognition.<ref>{{Cite web|url=https://medium.com/@ageitgey/machine-learning-is-fun-part-6-how-to-do-speech-recognition-with-deep-learning-28293c162f7a|title=Machine Learning is Fun Part 6: How to do Speech Recognition with Deep Learning|last=Geitgey|first=Adam|date=2016-12-24|website=Medium|access-date=2018-03-21}}</ref> |
* Spectrograms can be used with [[Recurrent neural network|recurrent neural networks]] for speech recognition.<ref>{{Cite web|url=https://medium.com/@ageitgey/machine-learning-is-fun-part-6-how-to-do-speech-recognition-with-deep-learning-28293c162f7a|title=Machine Learning is Fun Part 6: How to do Speech Recognition with Deep Learning|last=Geitgey|first=Adam|date=2016-12-24|website=Medium|access-date=2018-03-21}}</ref> |
||
| Line 52: | Line 53: | ||
==Limitations and resynthesis== |
==Limitations and resynthesis== |
||
From the formula above, it appears that a spectrogram contains no information about the exact, or even approximate, [[phase (waves)|phase]] of the signal that it represents. For this reason, it is not possible to reverse the process and generate a copy of the original signal from a spectrogram, though in situations where the exact initial phase is unimportant it may be possible to generate a useful approximation of the original signal. The Analysis & Resynthesis Sound Spectrograph<ref> |
From the formula above, it appears that a spectrogram contains no information about the exact, or even approximate, [[phase (waves)|phase]] of the signal that it represents. For this reason, it is not possible to reverse the process and generate a copy of the original signal from a spectrogram, though in situations where the exact initial phase is unimportant it may be possible to generate a useful approximation of the original signal. The Analysis & Resynthesis Sound Spectrograph<ref>{{cite web|url=http://arss.sourceforge.net|title=The Analysis & Resynthesis Sound Spectrograph|author=|date=|website=arss.sourceforge.net|accessdate=7 April 2018}}</ref> is an example of a computer program that attempts to do this. The [[pattern playback|Pattern Playback]] was an early speech synthesizer, designed at [[Haskins Laboratories]] in the late 1940s, that converted pictures of the acoustic patterns of speech (spectrograms) back into sound. |
||
In fact, there is some phase information in the spectrogram, but it appears in another form, as time delay (or group delay) which is the [[Dual (mathematics)|dual]] of the [[Instantaneous frequency#Instantaneous frequency|Instantaneous Frequency]] {{cn|date=November 2014}}. |
In fact, there is some phase information in the spectrogram, but it appears in another form, as time delay (or group delay) which is the [[Dual (mathematics)|dual]] of the [[Instantaneous frequency#Instantaneous frequency|Instantaneous Frequency]] {{cn|date=November 2014}}. |
||
Revision as of 16:11, 7 April 2018

A spectrogram is a visual representation of the spectrum of frequencies of sound or other signal as they vary with time. Spectrograms are sometimes called spectral waterfalls, voiceprints, or voicegrams.
Spectrograms are used extensively in the fields of music, sonar, radar, and speech processing,[1] seismology, and others. Spectrograms of audio can be used to identify spoken words phonetically, and to analyse the various calls of animals.
A spectrograph can be generated by an optical spectrometer, a bank of band-pass filters or by Fourier transform.
Format
A common format is a graph with two geometric dimensions: one axis represents time or RPM,[2][failed verification] the other axis is frequency; a third dimension indicating the amplitude of a particular frequency at a particular time is represented by the intensity or color of each point in the image.
There are many variations of format: sometimes the vertical and horizontal axes are switched, so time runs up and down; sometimes the amplitude is represented as the height of a 3D surface instead of color or intensity. The frequency and amplitude axes can be either linear or logarithmic, depending on what the graph is being used for. Audio would usually be represented with a logarithmic amplitude axis (probably in decibels, or dB), and frequency would be linear to emphasize harmonic relationships, or logarithmic to emphasize musical, tonal relationships.
-
 Spectrogram of this recording of a violin playing. Note the harmonics occurring at whole-number multiples of the fundamental frequency.
 -
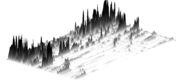 3D surface spectrogram of a part from a music piece.
 -
 Spectrogram of a male voice saying 'ta ta ta'.
 -
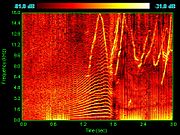 Spectrogram of dolphin vocalizations; chirps, clicks and harmonizing are visible as inverted Vs, vertical lines and horizontal striations respectively.


-
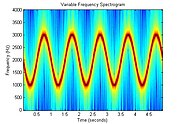 Spectrogram of an FM signal. In this case the signal frequency is modulated with a sinusoidal frequency vs. time profile.
 -
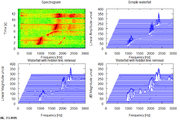
 Spectrum above and waterfall (Spectrogram) below of a 8MHz wide PAL-I Television signal.
 -
 Spectrogram of great tit song.
 -
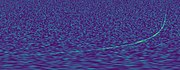 Spectrogram of a gravitational wave (GW170817).
 -
 Spectrogram and waterfalls of 3 whistled notes.


Generation
Spectrograms of light may be created directly using an optical spectrometer over time.
Spectrograms may created from a time-domain signal in one of two ways: approximated as a filterbank that results from a series of band-pass filters (this was the only way before the advent of modern digital signal processing), or calculated from the time signal using the Fourier transform. These two methods actually form two different time–frequency representations, but are equivalent under some conditions.
The bandpass filters method usually uses analog processing to divide the input signal into frequency bands; the magnitude of each filter's output controls a transducer that records the spectrogram as an image on paper.[3]
Creating a spectrogram using the FFT is a digital process. Digitally sampled data, in the time domain, is broken up into chunks, which usually overlap, and Fourier transformed to calculate the magnitude of the frequency spectrum for each chunk. Each chunk then corresponds to a vertical line in the image; a measurement of magnitude versus frequency for a specific moment in time (the midpoint of the chunk). These spectrums or time plots are then "laid side by side" to form the image or a three-dimensional surface,[4] or slightly overlapped in various ways, i.e. windowing. This process essentially corresponds to computing the squared magnitude of the short-time Fourier transform (STFT) of the signal — that is, for a window width , .[5]


Applications
- Early analog spectrograms were applied to a wide range of areas including the study of bird calls (such as that of the great tit), with current research continuing using modern digital equipment[6] and applied to all animal sounds. Contemporary use of the digital spectrogram is especially useful for studying frequency modulation (FM) in animal calls. Specifically, the distinguishing characteristics of FM chirps, broadband clicks, and social harmonizing are most easily visualized with the spectrogram.
- Spectrograms are useful in assisting in overcoming speech deficits and in speech training for the portion of the population that is profoundly deaf[7]
- The studies of phonetics and speech synthesis are often facilitated through the use of spectrograms.[8][9]
- By reversing the process of producing a spectrogram, it is possible to create a signal whose spectrogram is an arbitrary image. This technique can be used to hide a picture in a piece of audio and has been employed by several electronic music artists.[10] See also steganography.
- Some modern music is created using spectrograms as an intermediate medium; changing the intensity of different frequencies over time, or even creating new ones, by drawing them and then inverse transforming. See Audio timescale-pitch modification and Phase vocoder.
- Spectrograms can be used to analyze the results of passing a test signal through a signal processor such as a filter in order to check its performance.[11]
- High definition spectrograms are used in the development of RF and microwave systems[12]
- Spectrograms are now used to display scattering parameters measured with vector network analyzers[13]
- The US Geological Survey now provides real-time spectrogram displays from seismic stations[14]
- Spectrograms can be used with recurrent neural networks for speech recognition.[15]
Limitations and resynthesis
From the formula above, it appears that a spectrogram contains no information about the exact, or even approximate, phase of the signal that it represents. For this reason, it is not possible to reverse the process and generate a copy of the original signal from a spectrogram, though in situations where the exact initial phase is unimportant it may be possible to generate a useful approximation of the original signal. The Analysis & Resynthesis Sound Spectrograph[16] is an example of a computer program that attempts to do this. The Pattern Playback was an early speech synthesizer, designed at Haskins Laboratories in the late 1940s, that converted pictures of the acoustic patterns of speech (spectrograms) back into sound.
In fact, there is some phase information in the spectrogram, but it appears in another form, as time delay (or group delay) which is the dual of the Instantaneous Frequency [citation needed].
The size and shape of the analysis window can be varied. A smaller (shorter) window will produce more accurate results in timing, at the expense of precision of frequency representation. A larger (longer) window will provide a more precise frequency representation, at the expense of precision in timing representation. This is an instance of the Heisenberg uncertainty principle, that precision in two conjugate variables are inversely proportional to each other.
See also
References
- ^ JL Flanagan, Speech Analysis, Synthesis and Perception, Springer- Verlag, New York, 1972
- ^ "What's an Order?". siemens.com. 11 July 2016. Retrieved 7 April 2018.
- ^ "Spectrograph". www.sfu.ca. Retrieved 7 April 2018.
- ^ "Spectrograms". ccrma.stanford.edu. Retrieved 7 April 2018.
- ^ "STFT Spectrograms VI - NI LabVIEW 8.6 Help". zone.ni.com. Retrieved 7 April 2018.
{{cite web}}: line feed character in|title=at position 21 (help) - ^ "BIRD SONGS AND CALLS WITH SPECTROGRAMS ( SONOGRAMS ) OF SOUTHERN TUSCANY ( Toscana - Italy )". www.birdsongs.it. Retrieved 7 April 2018.
- ^ Saunders, Frank A.; Hill, William A.; Franklin, Barbara (1 December 1981). "A wearable tactile sensory aid for profoundly deaf children". Journal of Medical Systems. 5 (4): 265–270. doi:10.1007/BF02222144. Retrieved 7 April 2018 – via link.springer.com.
- ^ "Spectrogram Reading". ogi.edu. Retrieved 7 April 2018.
- ^ "Praat: doing Phonetics by Computer". www.fon.hum.uva.nl. Retrieved 7 April 2018.
- ^ "The Aphex Face - bastwood". www.bastwood.com. Retrieved 7 April 2018.
- ^ "SRC Comparisons". src.infinitewave.ca. Retrieved 7 April 2018.
- ^ "constantwave.com - constantwave Resources and Information". www.constantwave.com. Retrieved 7 April 2018.
{{cite web}}: no-break space character in|title=at position 17 (help) - ^ "Spectrograms for vector network analyzers". Archived from the original on 2012-08-10.
{{cite web}}: Unknown parameter|deadurl=ignored (|url-status=suggested) (help) - ^ "Real-time Spectrogram Displays". earthquake.usgs.gov. Retrieved 7 April 2018.
- ^ Geitgey, Adam (2016-12-24). "Machine Learning is Fun Part 6: How to do Speech Recognition with Deep Learning". Medium. Retrieved 2018-03-21.
- ^ "The Analysis & Resynthesis Sound Spectrograph". arss.sourceforge.net. Retrieved 7 April 2018.
External links
- See an online spectrogram of speech or other sounds captured by your computer's microphone.
- Generating a tone sequence whose spectrogram matches an arbitrary text, online
- Further information on creating a signal whose spectrogram is an arbitrary image
- Article describing the development of a software spectrogram
- History of spectrograms & development of instrumentation
- How to identify the words in a spectrogram from a linguistic professor's Monthly Mystery Spectrogram publication.