
Derbyshire County Council elections
Derbyshire County Council elections are held every four years. Derbyshire County Council is the upper-tier authority for the non-metropolitan county of Derbyshire in England. Since the last boundary changes in 2013, 64 councillors have been elected from 61 electoral divisions.[1]
Political control
Derbyshire County Council was first created in 1889. Its powers and responsibilities were significantly reformed under the Local Government Act 1972, with a new council elected in 1973 to act as a shadow authority ahead of the new powers coming into effect on 1 April 1974. Since 1973, political control of the council has been held by the following parties:[2][3]
| Party in control | Years | |
|---|---|---|
| Labour | 1973–1977 | |
| Conservative | 1977–1981 | |
| Labour | 1981–2009 | |
| Conservative | 2009–2012 | |
| No Overall Control | 2012–2013 | |
| Labour | 2013–2017 | |
| Conservative | 2017–present | |
Leadership
The leaders of the council since 1981 have been:[4]
| Councillor | Party | From | To | |
|---|---|---|---|---|
| David Bookbinder[5] | Labour | 1981 | 1992 | |
| Martin Doughty[6] | Labour | 1992 | 2001 | |
| John Williams[7] | Labour | 2001 | 2009 | |
| Andrew Lewer[8] | Conservative | 2009 | 2013 | |
| Anne Western | Labour | 2013 | 2017 | |
| Barry Lewis[9] | Conservative | 24 May 2017 | ||
Council elections
- 1973 Derbyshire County Council election
- 1977 Derbyshire County Council election
- 1981 Derbyshire County Council election
- 1985 Derbyshire County Council election
- 1989 Derbyshire County Council election
- 1993 Derbyshire County Council election
- 1997 Derbyshire County Council election
- 2001 Derbyshire County Council election
- 2005 Derbyshire County Council election (boundary changes increased the number of seats by 1)[10]
- 2009 Derbyshire County Council election
- 2013 Derbyshire County Council election (boundary changes)[1]
- 2017 Derbyshire County Council election
- 2021 Derbyshire County Council election
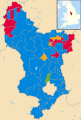
County result maps
-
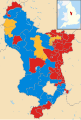 2005
2005 -
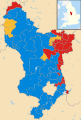 2009
2009 -
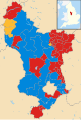 2013
2013 -
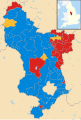 2017
2017 -
 2021
2021


By-election results
1993-1997
| Party | Candidate | Votes | % | ±% | |
|---|---|---|---|---|---|
| Labour | Paul Smith | 1,300 | 58.5 | ||
| Conservative | 620 | 27.9 | |||
| Liberal Democrats | 301 | 13.6 | |||
| Majority | 680 | 30.6 | |||
| Turnout | 2,221 | 25.0 | |||
| Labour hold | Swing | ||||
1997-2001
| Party | Candidate | Votes | % | ±% | |
|---|---|---|---|---|---|
| Labour | 966 | 71.7 | +6.5 | ||
| Conservative | 229 | 17.0 | −4.1 | ||
| Liberal Democrats | 153 | 11.4 | −2.3 | ||
| Majority | 737 | 54.7 | |||
| Turnout | 1,348 | 13.4 | |||
| Labour hold | Swing | ||||
| Party | Candidate | Votes | % | ±% | |
|---|---|---|---|---|---|
| Conservative | 1,789 | 49.1 | +2.8 | ||
| Labour | 1,611 | 44.0 | +3.0 | ||
| Liberal Democrats | 251 | 6.9 | −5.9 | ||
| Majority | 187 | 5.1 | |||
| Turnout | 3,651 | 28.7 | |||
| Conservative hold | Swing | ||||
2001-2005
| Party | Candidate | Votes | % | ±% | |
|---|---|---|---|---|---|
| Labour | 943 | 44.1 | −0.1 | ||
| Liberal Democrats | 710 | 33.2 | +12.3 | ||
| Conservative | 487 | 22.8 | −12.0 | ||
| Majority | 233 | 10.9 | |||
| Turnout | 2,140 | 23.0 | |||
| Labour hold | Swing | ||||
| Party | Candidate | Votes | % | ±% | |
|---|---|---|---|---|---|
| Conservative | Carol Hart | 1,443 | 56.8 | +12.3 | |
| Liberal Democrats | Janet Mallet | 571 | 22.5 | +5.7 | |
| Labour | 525 | 20.7 | −18.1 | ||
| Majority | 872 | 34.3 | |||
| Turnout | 2,539 | 30.3 | |||
| Conservative hold | Swing | ||||
2005-2009
| Party | Candidate | Votes | % | ±% | |
|---|---|---|---|---|---|
| Labour | Steve Pickering | 824 | 35.9 | −15.3 | |
| Conservative | Carolyn Renwick | 658 | 28.6 | +11.0 | |
| Independent | James Jesson | 300 | 13.1 | +4.1 | |
| BNP | Lewis Allesbrook | 253 | 11.0 | +11.0 | |
| Independent | David Walpole | 150 | 6.5 | −1.7 | |
| Liberal Democrats | Frank Higgins | 113 | 4.9 | −9.1 | |
| Majority | 166 | 7.3 | |||
| Turnout | 2,298 | 26.6 | |||
| Labour hold | Swing | ||||
2009-2013
| Party | Candidate | Votes | % | ±% | |
|---|---|---|---|---|---|
| Labour | Michelle Booth | 1,261 | 49.9 | −15.9 | |
| Conservative | Kevin Miller | 783 | 31.0 | −3.3 | |
| BNP | Mark Bailey | 327 | 12.9 | +12.9 | |
| Liberal Democrats | Richard Pyle | 158 | 6.2 | +6.2 | |
| Majority | 478 | 18.9 | |||
| Turnout | 2,529 | 29.2 | |||
| Labour hold | Swing | ||||
2013-2017
| Party | Candidate | Votes | % | ±% | |
|---|---|---|---|---|---|
| Conservative | David Taylor (E) | 1118 | 44.9 | +3.1 | |
| UKIP | David Fisher | 715 | 28.7 | +3.6 | |
| Labour | Mike Ratcliffe | 656 | 26.4 | +1.2 | |
| Majority | 403 | 16.2 | |||
| Turnout | 2489 | 25.8 | |||
| Conservative hold | Swing | ||||
| Party | Candidate | Votes | % | ±% | |
|---|---|---|---|---|---|
| Labour | Tricia Gilby (E) | 1293 | 62.0 | −6.7 | |
| UKIP | Paul Christopher Stone | 380 | 18.2 | +18.2 | |
| Independent | Mick Bagshaw | 157 | 7.5 | +7.5 | |
| Liberal Democrats | John Edward Ahern | 135 | 6.5 | −2.8 | |
| Conservative | Lewis Mark Preston | 120 | 5.8 | −5.4 | |
| Majority | |||||
| Turnout | 2085 | 21.9 | |||
| Labour hold | Swing | ||||
| Party | Candidate | Votes | % | ±% | |
|---|---|---|---|---|---|
| Conservative | Stephen Bull (E) | 4715 | 68.6 | +9.5 | |
| Labour | Simon John Meredith | 965 | 14.0 | +1.5 | |
| Green | Andrew White | 647 | 9.4 | +9.4 | |
| Liberal Democrats | David Rowe | 543 | 7.9 | −0.7 | |
| Majority | |||||
| Turnout | 6870 | 73.3 | |||
| Conservative hold | Swing | ||||
| Party | Candidate | Votes | % | ±% | |
|---|---|---|---|---|---|
| Conservative | Jo Wild | 1017 | 51.0 | +8.1 | |
| Labour | Martin Rutter | 466 | 21.5 | −1.7 | |
| Liberal Democrats | Michael Crapper | 314 | 13.6 | +4.6 | |
| UKIP | Mike Dawson | 285 | 13.1 | −11.0 | |
| Majority | 641 | 29.5 | |||
| Turnout | 2172 | ||||
| Conservative hold | Swing | ||||
2017-2021
| Party | Candidate | Votes | % | ±% | |
|---|---|---|---|---|---|
| Labour | Ruth George | 1851 | 50.4 | ||
| Conservative | John Frederick Walton | 1048 | 28.5 | ||
| Liberal Democrats | David William Lomax | 721 | 19.6 | ||
| Independent | Paddy Bann | 52 | 1.4 | ||
| Turnout | 3,672 | ||||
| Labour gain from Conservative | Swing | ||||
2021-2025
| Party | Candidate | Votes | % | ±% | |
|---|---|---|---|---|---|
| Labour | Joel Bryan | 1104 | 51.1 | ||
| Conservative | Chris Page | 723 | 33.5 | ||
| Liberal Democrats | Rachel Allen | 239 | 11.1 | ||
| Green | Ashley Dunn | 94 | 4.4 | ||
| Turnout | 2260 | 22.8 | |||
| Labour gain from Conservative | Swing | ||||
References
- ^ a b "The Derbyshire (Electoral Changes) Order 2012", legislation.gov.uk, The National Archives, SI 2012/2986, retrieved 21 August 2022
- ^ "Compositions calculator". The Elections Centre. Retrieved 10 August 2022.
- ^ "Derbyshire". BBC News Online. 19 April 2009. Retrieved 12 October 2009.
- ^ "Council minutes". Derbyshire County Council. Retrieved 21 August 2022.
- ^ Hess, John (13 April 2011). "David Bookbinder sees the Labour Party as the lesser of all evils". BBC News. Retrieved 21 August 2022.
- ^ Hattersley, Roy (9 March 2009). "Sir Martin Doughty". The Guardian. Retrieved 21 August 2022.
- ^ Paget, Tim (8 November 2019). "Tributes to Staveley community champion and former Derbyshire County Council leader John Williams". Derbyshire Times. Retrieved 21 August 2022.
- ^ "Derbyshire election 2013: Labour wins back control". BBC News. 3 May 2013. Retrieved 21 August 2022.
- ^ "Derbyshire County Council's new cabinet line-up announced". Derbyshire Times. 9 May 2017. Retrieved 21 August 2022.
- ^ "Local election results: Derbyshire". BBC News Online. Retrieved 12 October 2009.
- ^ "Lib Dems bounce back in byelections". guardian.co.uk. London. 30 April 2004. Retrieved 12 October 2009.
- ^ "Derbyshire elections 2009" (PDF). Derbyshire County Council. Archived from the original (PDF) on 15 August 2011. Retrieved 12 October 2009.
- ^ "2009 results by division". Derbyshire County Council. Archived from the original on 15 August 2011. Retrieved 12 October 2009.
- ^ http://www.derbyshire.gov.uk/images/Declaration%20of%20Notice%20of%20Poll%20-%20Brimington%202015_tcm44-260328.pdf [bare URL PDF]
- ^ http://www.derbyshire.gov.uk/images/Derbyshire%20County%20Council%20-%20Ashbourne%20Division_tcm44-264572.pdf [bare URL PDF]
- ^ http://www.derbyshire.gov.uk/images/Declaration%20of%20Result_tcm44-270770.pdf [bare URL PDF]
- ^ "Labour take Whaley Bridge for the first time in shock by-election result". Buxton Advertiser.
- By-election results Archived 29 March 2010 at the Wayback Machine