
File:Graph of average growth rate of EU countries and Euro zone.png
No higher resolution available.
Graph_of_average_growth_rate_of_EU_countries_and_Euro_zone.png (726 × 332 pixels, file size: 24 KB, MIME type: image/png)
| This is a file from the Wikimedia Commons. Information from its description page there is shown below. Commons is a freely licensed media file repository. You can help. |
Summary
| Description |
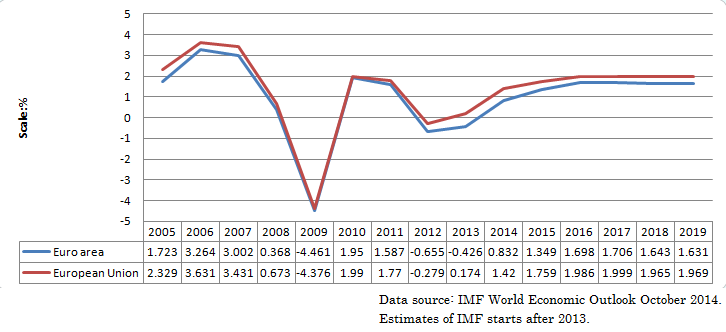
English: This is a graph of growth rate of EU countries and Euro zone (Growth rate of Real GDP). Data source is International Monetary Fund, World Economic Outlook Database October 2014.Estimates (of IMF) starts from 2013. The calculation is done by IMF. The calculation of average is done by myself in version 21:29, 4 November 2014. After this version, the calculation is done by IMF. |
| Date | |
| Source | I made this graph from IMF database, using EXCEL 2007. |
| Author | ShuBraque |
Licensing
I, the copyright holder of this work, hereby publish it under the following licenses:

|
Permission is granted to copy, distribute and/or modify this document under the terms of the GNU Free Documentation License, Version 1.2 or any later version published by the Free Software Foundation; with no Invariant Sections, no Front-Cover Texts, and no Back-Cover Texts. A copy of the license is included in the section entitled GNU Free Documentation License. |
This file is licensed under the Creative Commons Attribution-Share Alike 3.0 Unported license.
- You are free:
- to share – to copy, distribute and transmit the work
- to remix – to adapt the work
- Under the following conditions:
- attribution – You must give appropriate credit, provide a link to the license, and indicate if changes were made. You may do so in any reasonable manner, but not in any way that suggests the licensor endorses you or your use.
- share alike – If you remix, transform, or build upon the material, you must distribute your contributions under the same or compatible license as the original.
You may select the license of your choice.

|
The categories of this image need checking. You can do so here.
|
File history
Click on a date/time to view the file as it appeared at that time.
| Date/Time | Thumbnail | Dimensions | User | Comment | |
|---|---|---|---|---|---|
| current | 21:55, 4 November 2014 | | 726 × 332 (24 KB) | ShuBraque | Added some information about the data. |
| 21:49, 4 November 2014 |  | 726 × 313 (23 KB) | ShuBraque | This is a graph of average growth rate of EU countries and Euro zone (Growth rate of Real GDP). Data source is International Monetary Fund, World Economic Outlook Database October 2014.Estimates (of IMF). Calculation is done by IMF. | |
| 21:29, 4 November 2014 | 712 × 290 (17 KB) | ShuBraque | {{subst:Upload marker added by en.wp UW}} {{Information |Description = {{en|This is a graph of average growth rate of EU countries and Euro zone. Data source is International Monetary Fund, World Economic Outlook Database October 2014.Estimates (of IMF... |
File usage
No pages on the English Wikipedia use this file (pages on other projects are not listed).
Global file usage
The following other wikis use this file:
- Usage on ja.wikipedia.org