
File:World population history.svg

Size of this PNG preview of this SVG file: 750 × 450 pixels. Other resolutions: 320 × 192 pixels | 640 × 384 pixels | 1,024 × 614 pixels | 1,280 × 768 pixels | 2,560 × 1,536 pixels.
Original file (SVG file, nominally 750 × 450 pixels, file size: 10 KB)
| This is a file from the Wikimedia Commons. Information from its description page there is shown below. Commons is a freely licensed media file repository. You can help. |
Summary
| Description |
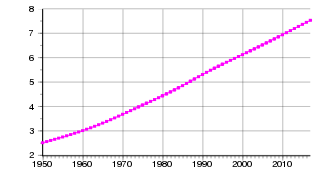
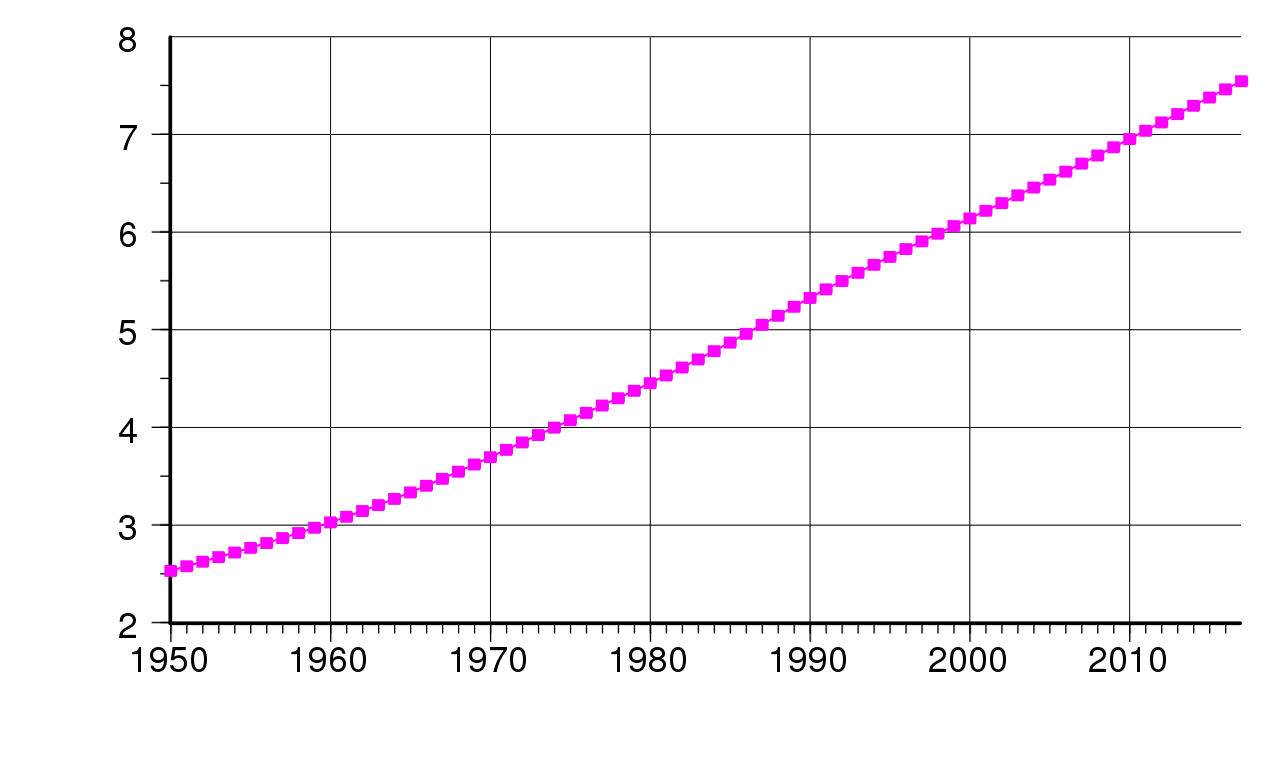
English: World population 1950-2017, in billions. |
| Date | |
| Source | Own work (Original text: Own work by uploader ; source figures now archived at https://web.archive.org/web/20060519101114/http://www.geohive.com/global/geo.php?xml=hist3&xsl=hist3) |
| Author | Demmo, Conscious |
| Other versions | Image:World population history.png |
| SVG development | This plot was created with Gnuplot. This plot uses embedded text that can be easily translated using a text editor. |
Licensing

|
Permission is granted to copy, distribute and/or modify this document under the terms of the GNU Free Documentation License, Version 1.2 or any later version published by the Free Software Foundation; with no Invariant Sections, no Front-Cover Texts, and no Back-Cover Texts. A copy of the license is included in the section entitled GNU Free Documentation License. |
| This file is licensed under the Creative Commons Attribution-Share Alike 3.0 Unported license. | ||
| Attribution: Demmo, Conscious | ||
| ||
| This licensing tag was added to this file as part of the GFDL licensing update. |
This file is licensed under the Creative Commons Attribution-Share Alike 2.5 Generic, 2.0 Generic and 1.0 Generic license.
- You are free:
- to share – to copy, distribute and transmit the work
- to remix – to adapt the work
- Under the following conditions:
- attribution – You must give appropriate credit, provide a link to the license, and indicate if changes were made. You may do so in any reasonable manner, but not in any way that suggests the licensor endorses you or your use.
- share alike – If you remix, transform, or build upon the material, you must distribute your contributions under the same or compatible license as the original.
You may select the license of your choice.
Sources
US Census Bureau International Data Base - Select "Region", table "Total Midyear Population, Area, Density", Regions: "World".
Gnuplot
Version 4.2 patchlevel 5
set term svg size 800,500 dynamic font "sans-serif"
set autoscale xfix
set grid
set style data linespoints
set pointsize 0.6
set datafile separator ","
unset key

set ylabel "Population, billions"
# set xtics add (2011) # Added for clarity, may be omitted if necessary.
plot "population.csv" using 3:($4/1e9) linetype rgb "#FF0000" pt 5
CSV table data file as retrieved from US Census Bureau International Database, without modifications.
Data file "population.csv"
"Total Midyear Population for World -  Aggregated"
Region,Country,Year,Population,"Area (sq. km.)","Density (persons per sq. km.)"
World," Aggregated",1950,2556505579,125640387,20.3
World," Aggregated",1951,2593858083,125640387,20.6
World," Aggregated",1952,2635734313,125640387,21.0
World," Aggregated",1953,2681062149,125640387,21.3
World," Aggregated",1954,2729285846,125640387,21.7
World," Aggregated",1955,2781208671,125640387,22.1
World," Aggregated",1956,2834464686,125640387,22.6
World," Aggregated",1957,2890572456,125640387,23.0
World," Aggregated",1958,2947421720,125640387,23.5
World," Aggregated",1959,3000072146,125640387,23.9
World," Aggregated",1960,3042445344,125640387,24.2
World," Aggregated",1961,3083506202,125640387,24.5
World," Aggregated",1962,3139715515,125640387,25.0
World," Aggregated",1963,3209533214,125640387,25.5
World," Aggregated",1964,3280976742,125640387,26.1
World," Aggregated",1965,3350247056,125640387,26.7
World," Aggregated",1966,3420543874,125640387,27.2
World," Aggregated",1967,3490288535,125640387,27.8
World," Aggregated",1968,3562353760,125640387,28.4
World," Aggregated",1969,3637276383,125640387,28.9
World," Aggregated",1970,3712963247,125640387,29.6
World," Aggregated",1971,3790831132,125640387,30.2
World," Aggregated",1972,3867338018,125640387,30.8
World," Aggregated",1973,3943176752,125640387,31.4
World," Aggregated",1974,4017813804,125640387,32.0
World," Aggregated",1975,4090414797,125640387,32.6
World," Aggregated",1976,4161640823,125640387,33.1
World," Aggregated",1977,4233639679,125640387,33.7
World," Aggregated",1978,4305732462,125640387,34.3
World," Aggregated",1979,4380675312,125640387,34.9
World," Aggregated",1980,4452942594,125640387,35.4
World," Aggregated",1981,4535670569,125640387,36.1
World," Aggregated",1982,4615594636,125640387,36.7
World," Aggregated",1983,4696609098,125640387,37.4
World," Aggregated",1984,4776733167,125640387,38.0
World," Aggregated",1985,4858255344,125640387,38.7
World," Aggregated",1986,4942034793,125640387,39.3
World," Aggregated",1987,5028295387,125640387,40.0
World," Aggregated",1988,5115225260,125640387,40.7
World," Aggregated",1989,5201771390,125640387,41.4
World," Aggregated",1990,5289040477,125640387,42.1
World," Aggregated",1991,5371956011,125640387,42.8
World," Aggregated",1992,5456702211,125640387,43.4
World," Aggregated",1993,5538785743,125640387,44.1
World," Aggregated",1994,5619414012,125640387,44.7
World," Aggregated",1995,5700328131,125640387,45.4
World," Aggregated",1996,5780525477,125640387,46.0
World," Aggregated",1997,5859076518,125640387,46.6
World," Aggregated",1998,5936654189,125640387,47.3
World," Aggregated",1999,6013490977,125640387,47.9
World," Aggregated",2000,6089648784,125640387,48.5
World," Aggregated",2001,6166108367,125640387,49.1
World," Aggregated",2002,6242347736,125640387,49.7
World," Aggregated",2003,6317998040,125640387,50.3
World," Aggregated",2004,6393741245,125640387,50.9
World," Aggregated",2005,6469688764,125640387,51.5
World," Aggregated",2006,6546299902,125640387,52.1
World," Aggregated",2007,6623914961,125640387,52.7
World," Aggregated",2008,6700983106,125640387,53.3
World," Aggregated",2009,6776763237,125640387,53.9
World," Aggregated",2010,6852472823,125640387,54.5
World," Aggregated",2011,6928198253,125640387,55.1
File history
Click on a date/time to view the file as it appeared at that time.
| Date/Time | Thumbnail | Dimensions | User | Comment | |
|---|---|---|---|---|---|
| current | 23:38, 3 November 2017 | | 750 × 450 (10 KB) | Delphi234 | Updated for year 2017 |
| 08:13, 27 April 2011 |  | 512 × 320 (18 KB) | Demmo | Updated for 2011, gnuplot | |
| 09:23, 22 September 2009 |  | 512 × 298 (3 KB) | Demmo | Updated for year 2009 | |
| 15:57, 10 July 2006 |  | 740 × 430 (3 KB) | Conscious | History of the world population. Plotted by myself as a replacement for en:Image:World population history.png using data from [http://www.geohive.com/global/geo.php?xml=hist3&xsl=hist3]. Category:Demography |
File usage
The following pages on the English Wikipedia use this file (pages on other projects are not listed):
Global file usage
The following other wikis use this file:
- Usage on de.wikinews.org
- Usage on el.wikipedia.org
- Usage on eo.wikipedia.org
- Usage on fi.wikipedia.org
- Usage on id.wikipedia.org
- Usage on it.wikipedia.org
- Usage on jv.wikipedia.org
- Usage on ko.wikipedia.org
- Usage on la.wikipedia.org
- Usage on ne.wikipedia.org
- Usage on no.wikipedia.org
- Usage on simple.wikipedia.org
- Usage on ta.wikipedia.org
- Usage on th.wikipedia.org
- Usage on vi.wikipedia.org