
File:Quanterr.png
No higher resolution available.
Quanterr.png (489 × 320 pixels, file size: 2 KB, MIME type: image/png)
| This is a file from the Wikimedia Commons. Information from its description page there is shown below. Commons is a freely licensed media file repository. You can help. |
Summary
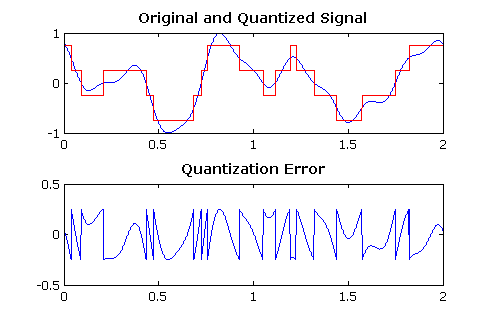
| Description | Plot of a quantized signal and its error |
| Date | |
| Source | Own work |
| Author | Atropos235 |
Source Code
close all; figure
t = 0:0.0001:2;
   % generate some nice looking signal then scale to +/- 1
x = 2*cos(2*pi*t)+1.5*cos(4*pi*t+2)+1*cos(5*pi*t)+0.5*cos(10*pi*t);
x = 2*(x - min(x))/(max(x)-min(x)) - 1;
   % quantization
n = 2; % bits
xq = floor((1-1e-12)*(x+1).*2.^(n-1));
xq = xq / (2^(n-1));
xq = xq - (2^n - 1) / 2^n;
   % error signal
qerr = x - xq;
   % plot
subplot(211); plot(t,x,'b',t,xq,'r'); title('Original and Quantized Signal');
subplot(212); plot(t,qerr,'b'); title('Quantization Error');
Licensing
| I, the copyright holder of this work, release this work into the public domain. This applies worldwide. In some countries this may not be legally possible; if so: I grant anyone the right to use this work for any purpose, without any conditions, unless such conditions are required by law. |
File history
Click on a date/time to view the file as it appeared at that time.
| Date/Time | Thumbnail | Dimensions | User | Comment | |
|---|---|---|---|---|---|
| current | 21:13, 6 May 2010 | | 489 × 320 (2 KB) | Aiyizo | losslessly compressed with pngout |
| 03:41, 24 February 2008 |  | 489 × 320 (5 KB) | Atropos235 | {{Information |Description=Plot of a quantized signal and it's error |Source=self-made |Date=23 February 2008 |Author= Atropos235 |Permission= |other_versions= }} ==Source Code== <pre><nowiki> close all; figure t = 0:0.0001:2; % gen |
File usage
No pages on the English Wikipedia use this file (pages on other projects are not listed).
Global file usage
The following other wikis use this file:
- Usage on el.wiktionary.org
- Usage on ja.wikipedia.org
- Usage on no.wikipedia.org
- Usage on zh.wikipedia.org