Gloucestershire County Council elections
Appearance
Gloucestershire County Council in England is elected every four years. Following last boundary changes in 2005, 63 councillors were elected from 53 divisions.[1] The last election took place on 2 May 2013, when all divisions were reduced to single members.
Political control
Since 1973 political control of the council has been held by the following parties:[2]
| Party in control | Years | |
|---|---|---|
| No overall control | 1973–1977 | |
| Conservative | 1977–1981 | |
| No overall control | 1981–2005 | |
| Conservative | 2005–2013 | |
| No overall control | 2013–2017 | |
| Conservative | 2017–present | |
Leadership
The leaders of the council since 2001 have been:[3]
| Councillor | Party | From | To | |
|---|---|---|---|---|
| Peter Clarke | Labour | 3 Sep 2001 | 8 May 2005 | |
| Barry Dare | Conservative | 18 May 2005 | 19 May 2010 | |
| Mark Hawthorne | Conservative | 19 May 2010 | ||
Council elections
- 1973 Gloucestershire County Council election
- 1977 Gloucestershire County Council election
- 1981 Gloucestershire County Council election
- 1985 Gloucestershire County Council election
- 1989 Gloucestershire County Council election
- 1993 Gloucestershire County Council election
- 2001 Gloucestershire County Council election
- 2005 Gloucestershire County Council election
- 2009 Gloucestershire County Council election
- 2013 Gloucestershire County Council election
- 2017 Gloucestershire County Council election
- 2021 Gloucestershire County Council election
County result maps
-
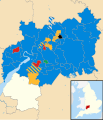
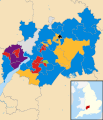
2009 results map
-
2013 results map
-
2017 results map
-
2021 results map
By-election results
1993-1997
| Party | Candidate | Votes | % | ±% | |
|---|---|---|---|---|---|
| Liberal Democrats | 1,064 | 80.0 | |||
| Labour | 266 | 20.0 | |||
| Majority | 798 | 60.0 | |||
| Turnout | 1,370 | 16.0 | |||
| Liberal Democrats hold | Swing | ||||
1997-2001
| Party | Candidate | Votes | % | ±% | |
|---|---|---|---|---|---|
| Conservative | 1,274 | 44.0 | +9.1 | ||
| Liberal Democrats | 982 | 33.9 | +11.2 | ||
| Labour | 642 | 22.2 | −20.2 | ||
| Majority | 292 | 10.1 | |||
| Turnout | 2,898 | 24.0 | |||
| Conservative gain from Labour | Swing | ||||
| Party | Candidate | Votes | % | ±% | |
|---|---|---|---|---|---|
| Conservative | 1,087 | 60.8 | +13.6 | ||
| Liberal Democrats | 701 | 39.2 | −3.4 | ||
| Majority | 386 | 21.6 | |||
| Turnout | 1,788 | 37.9 | |||
| Conservative hold | Swing | ||||
| Party | Candidate | Votes | % | ±% | |
|---|---|---|---|---|---|
| Conservative | 1,230 | 71.8 | +31.3 | ||
| Liberal Democrats | 297 | 17.3 | −28.5 | ||
| Labour | 186 | 10.9 | −2.8 | ||
| Majority | 939 | 54.5 | |||
| Turnout | 1,713 | 26.2 | |||
| Conservative gain from Liberal Democrats | Swing | ||||
| Party | Candidate | Votes | % | ±% | |
|---|---|---|---|---|---|
| Liberal Democrats | 958 | 63.2 | −2.0 | ||
| Conservative | 416 | 27.5 | +5.8 | ||
| Labour | 141 | 9.3 | −3.9 | ||
| Majority | 542 | 35.7 | |||
| Turnout | 1,515 | 21.7 | |||
| Liberal Democrats hold | Swing | ||||
| Party | Candidate | Votes | % | ±% | |
|---|---|---|---|---|---|
| Liberal Democrats | 922 | 46.6 | |||
| Labour | 621 | 31.4 | |||
| Conservative | 437 | 22.1 | |||
| Majority | 301 | 15.2 | |||
| Turnout | 1,980 | 22.5 | |||
| Liberal Democrats gain from Labour | Swing | ||||
| Party | Candidate | Votes | % | ±% | |
|---|---|---|---|---|---|
| Conservative | 835 | 44.4 | +20.1 | ||
| Labour | 694 | 36.9 | +5.3 | ||
| Liberal Democrats | 350 | 18.6 | −25.5 | ||
| Majority | 141 | 7.5 | |||
| Turnout | 1,879 | 31.0 | |||
| Conservative gain from Liberal Democrats | Swing | ||||
2005-2009
| Party | Candidate | Votes | % | ±% | |
|---|---|---|---|---|---|
| Conservative | Antonia Noble | 2,208 | 52.3 | −6.6 | |
| Liberal Democrats | Martin Dunne | 1,605 | 38.0 | +7.3 | |
| Labour | Brian Hughes | 226 | 5.4 | +6.6 | |
| Green | Janet Thomas | 184 | 4.3 | +7.3 | |
| Majority | 603 | 14.3 | |||
| Turnout | 4,223 | 30.0 | |||
| Conservative hold | Swing | ||||
| Party | Candidate | Votes | % | ±% | |
|---|---|---|---|---|---|
| Liberal Democrats | Michael Collins | 1,040 | 52.9 | +41.0 | |
| Conservative | Ronald Furolo | 751 | 38.2 | +11. | |
| Labour | Terry Haines | 175 | 8.9 | −15.9 | |
| Majority | 289 | 14.7 | |||
| Turnout | 1,966 | 31.4 | |||
| Liberal Democrats gain from Independent | Swing | ||||
References
- ^ "Detailed results of the County Council Elections 2005 and 2001". Gloucestershire County Council. Retrieved 18 March 2010.
- ^ "Gloucestershire". BBC News Online. 19 April 2009. Retrieved 18 March 2010.
- ^ "Council minutes". Gloucestershire County Council. Retrieved 25 June 2022.


