
File:2000patent.PNG
Size of this preview: 800 × 351 pixels. Other resolutions: 320 × 140 pixels | 640 × 281 pixels | 1,425 × 625 pixels.
Original file (1,425 × 625 pixels, file size: 58 KB, MIME type: image/png)
| This is a file from the Wikimedia Commons. Information from its description page there is shown below. Commons is a freely licensed media file repository. You can help. |
Summary
| Description |
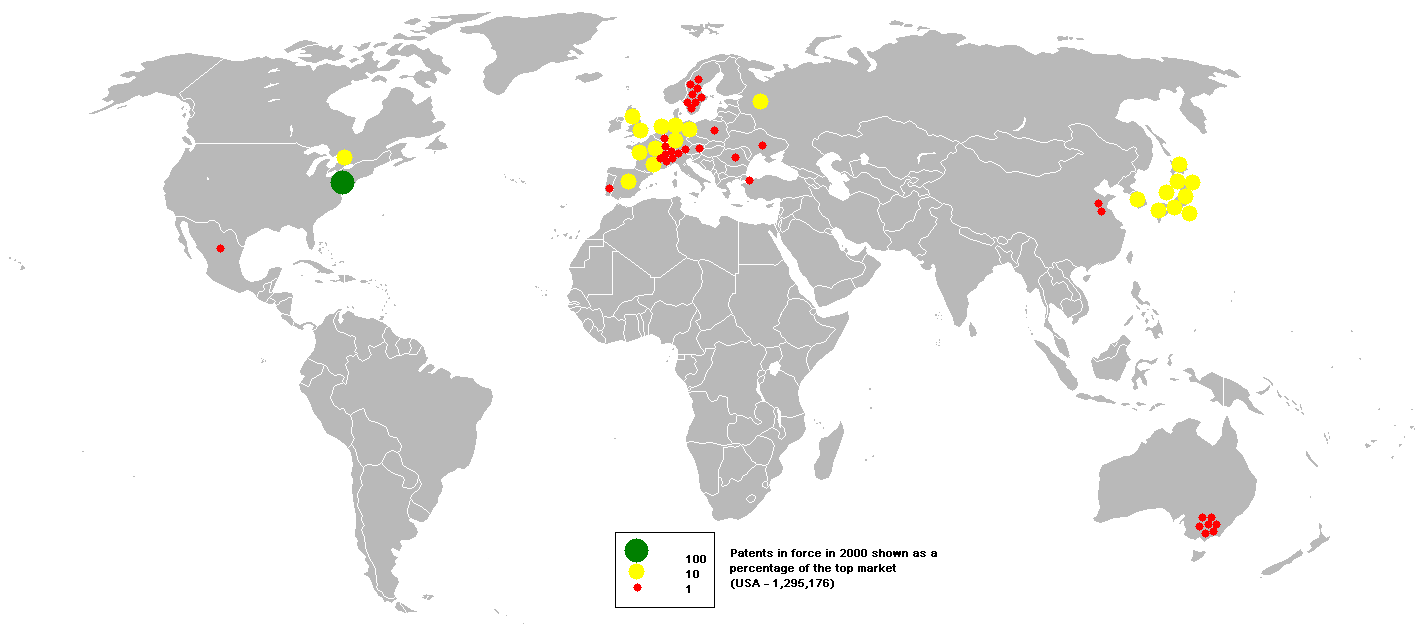
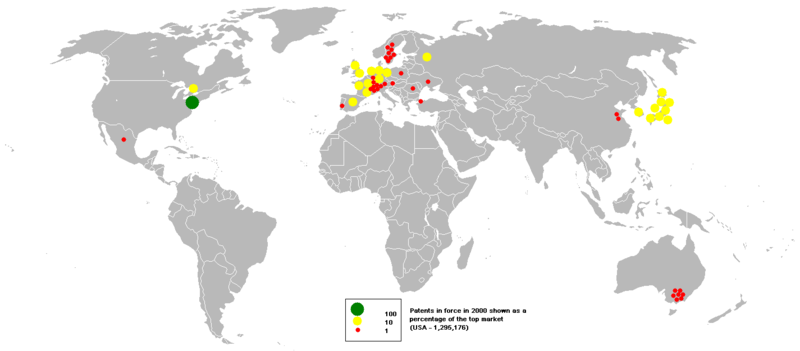
English: This bubble map shows the global distribution of patents in force in 2000 as a percentage of the top market (USA - 1,295,176).
This map is consistent with incomplete set of data too as long as the top producer is known. It resolves the accessibility issues faced by colour-coded maps that may not be properly rendered in old computer screens. Data was extracted on 16th June 2007. Source - http://unstats.un.org/unsd/cdb/cdb_source_xrxx.asp?source_code=6 Based on Image:BlankMap-World.png |
| Date | |
| Source | Transferred from en.wikipedia to Commons. |
| Author | Anwar saadat at English Wikipedia |
Licensing
Anwar saadat at English Wikipedia, the copyright holder of this work, hereby publishes it under the following license:
This file is licensed under the Creative Commons Attribution-Share Alike 3.0 Unported license.
Attribution: Anwar saadat at English Wikipedia
- You are free:
- to share – to copy, distribute and transmit the work
- to remix – to adapt the work
- Under the following conditions:
- attribution – You must give appropriate credit, provide a link to the license, and indicate if changes were made. You may do so in any reasonable manner, but not in any way that suggests the licensor endorses you or your use.
- share alike – If you remix, transform, or build upon the material, you must distribute your contributions under the same or compatible license as the original.
Original upload log
The original description page was here. All following user names refer to en.wikipedia.
- 2007-06-16 15:56 Anwar saadat 1425×625× (59636 bytes)
File history
Click on a date/time to view the file as it appeared at that time.
| Date/Time | Thumbnail | Dimensions | User | Comment | |
|---|---|---|---|---|---|
| current | 21:16, 30 December 2011 | | 1,425 × 625 (58 KB) | Innotata | {{Information |Description={{en|This bubble map shows the global distribution of patents in force in 2000 as a percentage of the top market (USA - 1,295,176). This map is consistent with incomplete set of data |
File usage
No pages on the English Wikipedia use this file (pages on other projects are not listed).
Global file usage
The following other wikis use this file:
- Usage on ta.wikipedia.org