
File:GISS-TGGWS-temp-data-comparison.svg

Original file (SVG file, nominally 1,052 × 744 pixels, file size: 25 KB)
| This is a file from the Wikimedia Commons. Information from its description page there is shown below. Commons is a freely licensed media file repository. You can help. |
Summary
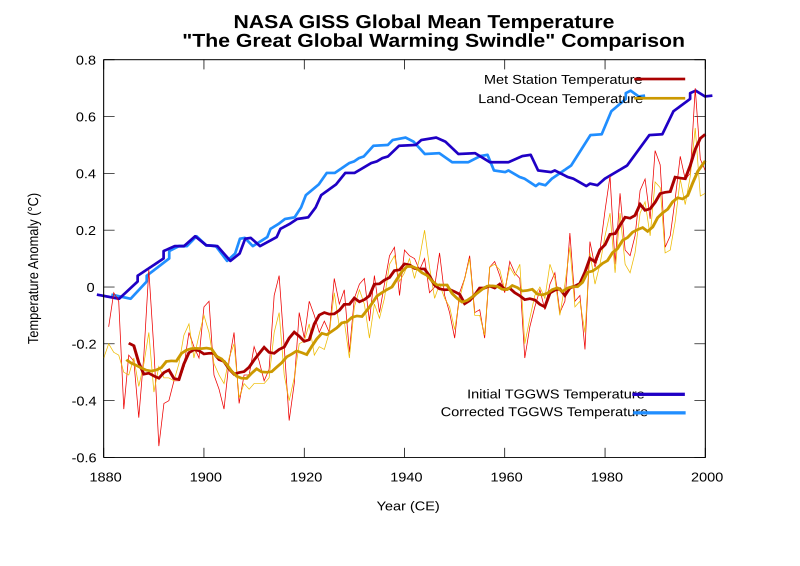
Comparison of temperature anomaly data as presented on "The Great Global Warming Swindle" with temperature anomaly data from NASA GISS. Data for "The Great Global Warming Swindle" were obtained by tracing a screen capture [1] and the corrected version used in the second screening of the program [2]. NASA GISS data were obtained from publicly available sources [3]. The graph includes yearly average global temperature both for data from Met Stations and for combined Land-Ocean temperature, with 10 year moving averages overlayed.
Licensing
This figure was produced by Leland McInnes using gnuplot and Inkscape and is licensed under the GFDL. All data is from publicly available sources.

|
Permission is granted to copy, distribute and/or modify this document under the terms of the GNU Free Documentation License, Version 1.2 or any later version published by the Free Software Foundation; with no Invariant Sections, no Front-Cover Texts, and no Back-Cover Texts. A copy of the license is included in the section entitled GNU Free Documentation License. |
| This file is licensed under the Creative Commons Attribution-Share Alike 3.0 Unported license. | ||
| ||
| This licensing tag was added to this file as part of the GFDL licensing update. |
Data Sources
- (red) Met Station Temperature Data: http://data.giss.nasa.gov/gistemp/tabledata/GLB.Ts.txt
- (orange) Land-Ocean Temperature Data:http://data.giss.nasa.gov/gistemp/tabledata/GLB.Ts+dSST.txt
Related Images


![[1]](http://i157.photobucket.com/albums/t63/izzy_bizzy_photo/capture.jpg)
![[2]](http://scienceblogs.com/stoat/upload/2007/03/tggws-2.jpg)
File history
Click on a date/time to view the file as it appeared at that time.
| Date/Time | Thumbnail | Dimensions | User | Comment | |
|---|---|---|---|---|---|
| current | 08:28, 4 April 2007 | | 1,052 × 744 (25 KB) | Nils Simon | == Summary == Comparison of temperature anomaly data as presented on "The Great Global Warming Swindle" with temperature anomaly data from NASA GISS. Data for "The Great Global Warming Swindle" was obtained by tracing a screen capture [http://i157.photobu |
File usage
Global file usage
The following other wikis use this file:
- Usage on de.wikipedia.org
- Usage on es.wikipedia.org
- Usage on pl.wikipedia.org