
File:Zins-Vasicek.png

Size of this preview: 800 × 514 pixels. Other resolutions: 320 × 205 pixels | 640 × 411 pixels | 1,003 × 644 pixels.
Original file (1,003 × 644 pixels, file size: 12 KB, MIME type: image/png)
| This is a file from the Wikimedia Commons. Information from its description page there is shown below. Commons is a freely licensed media file repository. You can help. |
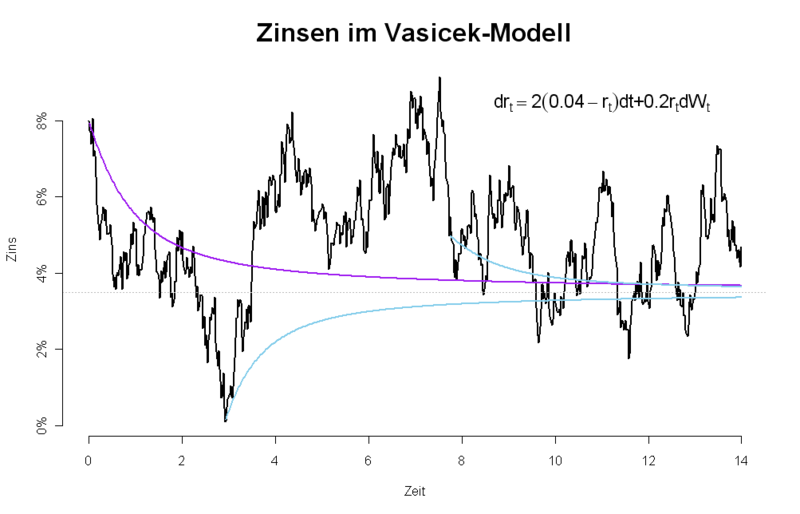
| Description | a path of a gaussion ornstein uhlenbeck short rate process and the corresponding yield curve at T=0 (purple) and some points in time later. |
| Date | |
| Source | created by myself with GNU R, see source below |
| Author | Thomas Steiner |
| Permission (Reusing this file) |
Thomas Steiner put it under the CC-by-SA 2.5. |
This file is licensed under the Creative Commons Attribution-Share Alike 2.5 Generic license.
- You are free:
- to share – to copy, distribute and transmit the work
- to remix – to adapt the work
- Under the following conditions:
- attribution – You must give appropriate credit, provide a link to the license, and indicate if changes were made. You may do so in any reasonable manner, but not in any way that suggests the licensor endorses you or your use.
- share alike – If you remix, transform, or build upon the material, you must distribute your contributions under the same or compatible license as the original.
R-source:
## einfachstes bsp, yields in Vasicek, Notation wie Brigo/Mercurio
#übernimmt log(z) als Parameter (nichtnegativ)
yvas<-function(ttm,para,rt) {
  lambda=exp(para$lambda)
  theta=exp(para$theta)
  sigma2=(exp(para$sigma))^2
  B=1/lambda*(1-exp(-lambda*ttm))
  lnA=(theta-sigma2/(2*lambda^2))*(B-ttm)-sigma2/(4*lambda)*B^2
  return( -(lnA-B*rt)/ttm )
}


### OU-levy processes ################################
## starting at time t=0 at Z_0=para$r until time t=T in "steps" equidistant steps; mean reversion "mr"
## parameters of the distribution of the bdlp are stored in param
process.ou<-function(para,type,T=1,steps=500) {
  dt=T/(steps-1)
  ou=array(para$r,dim=steps)
  if (type=="cauchy") {
    dLt=rcauchy(steps-1, location=para$location, scale=para$scale*dt)
  } else if (type=="gamma") {
    dLt=rgamma(n=steps-1, shape=para$shape, scale=para$scale*dt)
  } else if (type=="IG") {
    dLt=rinvGauss(n=steps-1, nu=(para$delta*dt)/para$gamma, lambda=(para$delta*dt)^2)
  } else if (type=="norm") {
    dLt=rnorm(n=steps-1, mean=para$lambda*para$theta*dt, sd=para$sigma*dt)
  } else {
    print("process.ou:: this type of OU-process is not yet implemented")
  }
  for (tm in 1:(steps-1)) {
    ou[tm+1]=ou[tm]-para$lambda*ou[tm]*dt+dLt[tm]
  }
  return (ou)
}

set.seed(28019180)
time=seq(0,14,length=700)
pa=list(lambda=2,theta=0.04,sigma=0.2,r=0.08)
lpa=list(lambda=log(pa$lambda),theta=log(pa$theta),sigma=log(pa$sigma)) #log-parameter
gou=process.ou(pa,"norm",T=14,steps=length(time))

plot(time,gou,type="l",lwd=2,axes=F,xlab="Zeit",ylab="Zins",main="Zinsen im Vasicek-Modell",cex.main=2)
abline(h=pa$theta-pa$sigma^2/(2*pa$lambda^2),lty="dotted",col="grey")
lines(time,yvas(time,lpa,pa$r),col="purple",lwd=2)
yticks=axTicks(2)
axis(1)
axis(side=2,at=yticks,labels=paste(format(100*yticks,digits=3),"%",sep=""))

text(x=10.4,y=0.0325,expression(paste("d",r[t]==2(0.04-r[t]),"dt+",0.2,r[t],"d",  W[t])),cex=1.4)
File history
Click on a date/time to view the file as it appeared at that time.
| Date/Time | Thumbnail | Dimensions | User | Comment | |
|---|---|---|---|---|---|
| current | 06:15, 16 October 2011 | | 1,003 × 644 (12 KB) | Thire | 2 neue kurven |
| 13:58, 3 July 2007 |  | 1,200 × 900 (13 KB) | Thire | {{Information |Description = a path of a gaussion ornstein uhlenbeck short rate process and the corresponding yield curve. |Source = created by myself with GNU R, see source below |Date = 3 july 2007 |Author = Thomas Steiner |Permis |
File usage
The following pages on the English Wikipedia use this file (pages on other projects are not listed):
Global file usage
The following other wikis use this file:
- Usage on fa.wikipedia.org
- Usage on ja.wikipedia.org