
Newark and Sherwood District Council elections
(Redirected from Newark and Sherwood local elections)
Newark and Sherwood District Council elections are held every four years. Newark and Sherwood District Council is the local authority for the non-metropolitan district of Newark and Sherwood in Nottinghamshire, England. Since the last boundary changes in 2015, 39 councillors have been elected from 21 wards.[1]
Council elections
[edit]- 1973 Newark District Council election
- 1976 Newark District Council election
- 1979 Newark District Council election (New ward boundaries)[2]
- 1983 Newark District Council election
- 1987 Newark District Council election (Some new ward boundaries & district boundary changes also took place)[3][4]
- 1991 Newark District Council election (District boundary changes took place but the number of seats remained the same)[5]
- 1995 Newark District Council election
- 1999 Newark and Sherwood District Council election
- 2003 Newark and Sherwood District Council election (New ward boundaries reduced the number of seats by 8)[6][7]
- 2007 Newark and Sherwood District Council election (New ward boundaries)[8][9]
- 2011 Newark and Sherwood District Council election
- 2015 Newark and Sherwood District Council election (New ward boundaries)[1]
- 2019 Newark and Sherwood District Council election
- 2023 Newark and Sherwood District Council election
Results maps
[edit]-
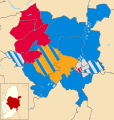
 2015 results map
 -
 2019 results map
 -
 2023 results map


By-election results
[edit]1995-1999
[edit]| Party | Candidate | Votes | % | ±% | |
|---|---|---|---|---|---|
| Conservative | 492 | 46.3 | |||
| Labour | 378 | 35.6 | |||
| Liberal Democrats | 193 | 18.1 | |||
| Majority | 114 | 10.7 | |||
| Turnout | 1,063 | 23.0 | |||
| Conservative gain from Labour | Swing | ||||
| Party | Candidate | Votes | % | ±% | |
|---|---|---|---|---|---|
| Liberal Democrats | 550 | 60.0 | −3.4 | ||
| Conservative | 294 | 32.1 | +11.4 | ||
| Labour | 73 | 8.0 | −7.9 | ||
| Majority | 256 | 27.9 | |||
| Turnout | 917 | 36.0 | |||
| Liberal Democrats hold | Swing | ||||
| Party | Candidate | Votes | % | ±% | |
|---|---|---|---|---|---|
| Labour | unopposed | ||||
| Labour hold | Swing | ||||
| Party | Candidate | Votes | % | ±% | |
|---|---|---|---|---|---|
| Independent | 609 | 54.7 | |||
| Labour | 505 | 45.3 | |||
| Majority | 104 | 9.4 | |||
| Turnout | 1,114 | ||||
| Independent gain from Labour | Swing | ||||
| Party | Candidate | Votes | % | ±% | |
|---|---|---|---|---|---|
| Labour | unopposed | ||||
| Labour hold | Swing | ||||
| Party | Candidate | Votes | % | ±% | |
|---|---|---|---|---|---|
| Conservative | 394 | 72.6 | +31.7 | ||
| Labour | 116 | 21.4 | −23.4 | ||
| Independent Labour | 33 | 6.1 | +6.1 | ||
| Majority | 278 | 51.2 | |||
| Turnout | 543 | 29.9 | |||
| Conservative gain from Labour | Swing | ||||
1999-2003
[edit]| Party | Candidate | Votes | % | ±% | |
|---|---|---|---|---|---|
| Conservative | 672 | 65.1 | |||
| Labour | 210 | 20.3 | |||
| Liberal Democrats | 150 | 14.5 | |||
| Majority | 462 | 44.8 | |||
| Turnout | 1,032 | 31.0 | |||
| Conservative gain from Independent | Swing | ||||
| Party | Candidate | Votes | % | ±% | |
|---|---|---|---|---|---|
| Independent | 599 | 71.2 | +40.2 | ||
| Labour | 242 | 28.8 | −0.8 | ||
| Majority | 357 | 42.4 | |||
| Turnout | 841 | 18.5 | |||
| Independent gain from Labour | Swing | ||||
2003-2007
[edit]| Party | Candidate | Votes | % | ±% | |
|---|---|---|---|---|---|
| Labour | David Thompson | 361 | 50.3 | +16.0 | |
| Independent | William Giles | 272 | 37.9 | −6.5 | |
| Conservative | Carol Hewson | 84 | 11.7 | +11.7 | |
| Majority | 89 | 12.4 | |||
| Turnout | 717 | 24.9 | |||
| Labour hold | Swing | ||||
| Party | Candidate | Votes | % | ±% | |
|---|---|---|---|---|---|
| Conservative | Kevin Rontree | 744 | 67.0 | +5.1 | |
| Liberal Democrats | Declan Logue | 213 | 19.2 | −2.8 | |
| Labour | Matt Stevenson-Dodd | 154 | 13.9 | −2.2 | |
| Majority | 531 | 47.8 | |||
| Turnout | 1,111 | 29.7 | |||
| Conservative hold | Swing | ||||
| Party | Candidate | Votes | % | ±% | |
|---|---|---|---|---|---|
| Liberal Democrats | Eileen Rodgers | 376 | 52.7 | −8.7 | |
| Conservative | 338 | 47.3 | +8.7 | ||
| Majority | 38 | 5.4 | |||
| Turnout | 714 | 42.9 | |||
| Liberal Democrats hold | Swing | ||||
| Party | Candidate | Votes | % | ±% | |
|---|---|---|---|---|---|
| Conservative | Betty Brooks | 271 | 58.7 | +8.2 | |
| Labour | Janet Weinbren | 103 | 22.3 | −12.0 | |
| Independent | Anne Trout | 88 | 19.0 | +19.0 | |
| Majority | 168 | 36.4 | |||
| Turnout | 462 | ||||
| Conservative hold | Swing | ||||
| Party | Candidate | Votes | % | ±% | |
|---|---|---|---|---|---|
| Labour | Russell Snood | unopposed | |||
| Labour hold | Swing | ||||
2007-2011
[edit]| Party | Candidate | Votes | % | ±% | |
|---|---|---|---|---|---|
| Independent | Shirley Moore | 715 | 60.9 | +6.8 | |
| Labour | John Benson | 459 | 39.1 | +8.9 | |
| Majority | 256 | 21.8 | |||
| Turnout | 1,174 | 28.9 | |||
| Independent hold | Swing | ||||
| Party | Candidate | Votes | % | ±% | |
|---|---|---|---|---|---|
| Conservative | Maxwell Cope | 310 | 49.8 | −17.1 | |
| Independent | Helen Gent | 173 | 27.8 | +27.8 | |
| Liberal Democrats | Antony Barson | 140 | 22.5 | +22.5 | |
| Majority | 137 | 22.0 | |||
| Turnout | 623 | 16.3 | |||
| Conservative hold | Swing | ||||
| Party | Candidate | Votes | % | ±% | |
|---|---|---|---|---|---|
| Labour | Sheila Soar | 326 | 43.4 | +7.3 | |
| Liberal Democrats | Christopher Orton | 216 | 28.8 | +28.8 | |
| Independent | Lynn Buttery | 157 | 20.9 | −22.3 | |
| Conservative | Stefan Prest | 52 | 6.9 | −13.8 | |
| Majority | 110 | 14.6 | |||
| Turnout | 751 | 22.9 | |||
| Labour gain from Independent | Swing | ||||
| Party | Candidate | Votes | % | ±% | |
|---|---|---|---|---|---|
| Conservative | Simon Dawson | 413 | 48.2 | −0.7 | |
| Liberal Democrats | Declan Logue | 296 | 34.7 | +7.8 | |
| Labour | Douglas Hough | 147 | 17.2 | −7.1 | |
| Majority | 117 | 13.5 | |||
| Turnout | 856 | 16.6 | |||
| Conservative hold | Swing | ||||
| Party | Candidate | Votes | % | ±% | |
|---|---|---|---|---|---|
| Labour | Linda Tift | 735 | 66.9 | +33.0 | |
| Conservative | Mike Warner | 219 | 19.9 | −6.6 | |
| Independent | Alan Armin | 144 | 13.1 | +13.1 | |
| Majority | 516 | 47.0 | |||
| Turnout | 1,098 | ||||
| Labour hold | Swing | ||||
2011-2015
[edit]| Party | Candidate | Votes | % | ±% | |
|---|---|---|---|---|---|
| Conservative | Tim Wendels | 787 | 51.5 | N/A | |
| Liberal Democrats | William Davison | 534 | 34.9 | N/A | |
| Labour | Daniel Hibberd | 117 | 7.7 | N/A | |
| Independent | Tim Cutler | 91 | 6.0 | N/A | |
| Majority | 253 | 16.5 | |||
| Turnout | 1,529 | ||||
| Conservative hold | Swing | ||||
| Party | Candidate | Votes | % | ±% | |
|---|---|---|---|---|---|
| Conservative | Derek Evans | 1,112 | 75.0 | +9.6 | |
| Labour | Daniel Hibberd | 370 | 25.0 | +25.0 | |
| Majority | 742 | 50.0 | |||
| Turnout | 1,482 | ||||
| Conservative hold | Swing | ||||
| Party | Candidate | Votes | % | ±% | |
|---|---|---|---|---|---|
| Conservative | Frank Taylor | 1,174 | 63.3 | +4.6 | |
| Labour | Glenn Bardill | 682 | 36.7 | −4.6 | |
| Majority | 492 | 26.5 | |||
| Turnout | 1,856 | ||||
| Conservative hold | Swing | ||||
| Party | Candidate | Votes | % | ±% | |
|---|---|---|---|---|---|
| Conservative | Richard Shillito | 568 | 41.2 | −33.8 | |
| Independent | David Clarke | 476 | 34.5 | +34.5 | |
| UKIP | Sara Chadd | 218 | 15.8 | +15.8 | |
| Labour | Kieran Owen | 118 | 8.6 | −16.4 | |
| Majority | 92 | 6.7 | |||
| Turnout | 1,380 | ||||
| Conservative hold | Swing | ||||
| Party | Candidate | Votes | % | ±% | |
|---|---|---|---|---|---|
| Labour | Michael Pringle | 837 | 58.1 | +7.5 | |
| Conservative | Mary Brown | 323 | 22.4 | −4.6 | |
| UKIP | Moritz Dawkins | 280 | 19.4 | +19.4 | |
| Majority | 514 | 35.7 | |||
| Turnout | 1,440 | ||||
| Labour hold | Swing | ||||
2015-2019
[edit]| Party | Candidate | Votes | % | ±% | |
|---|---|---|---|---|---|
| Conservative | Lydia Hurst | 483 | 82.4 | +25.4 | |
| Liberal Democrats | Marylyn Rayner | 103 | 17.6 | +17.6 | |
| Majority | 380 | 64.9 | |||
| Turnout | 586 | ||||
| Conservative hold | Swing | ||||
| Party | Candidate | Votes | % | ±% | |
|---|---|---|---|---|---|
| Labour | Neal Mitchell | 1,469 | 61.7 | −3.3 | |
| Conservative | Glenn Bardill | 913 | 38.3 | +3.3 | |
| Majority | 556 | 23.3 | |||
| Turnout | 2,382 | ||||
| Labour hold | Swing | ||||
2019-2023
[edit]| Party | Candidate | Votes | % | ±% | |
|---|---|---|---|---|---|
| Conservative | Tim Wildgust | 542 | 61.2 | +8.8 | |
| Labour | Derek Batey | 283 | 32.0 | −15.6 | |
| Independent | Jeremy Spry | 60 | 6.8 | +6.8 | |
| Majority | 259 | 29.3 | |||
| Turnout | 885 | ||||
| Conservative hold | Swing | ||||
| Party | Candidate | Votes | % | ±% | |
|---|---|---|---|---|---|
| Conservative | Jack Kellas | 310 | |||
| Conservative | Simon Haynes | 267 | |||
| Independent | Ryan Bickerton | 236 | |||
| Independent | Deb's Darby | 181 | |||
| Labour | Lisa Geary | 177 | |||
| Labour | Mark Palmer | 162 | |||
| Liberal Democrats | Ryan Cullen | 104 | |||
| Green | Steve Platt | 81 | |||
| Liberal Democrats | Keith Melton | 59 | |||
| Green | Mike Poyzer | 57 | |||
| Conservative gain from Independent | Swing | ||||
| Conservative gain from Independent | Swing | ||||
| Party | Candidate | Votes | % | ±% | |
|---|---|---|---|---|---|
| Independent | Tina Thompson | 650 | 66.2 | +66.2 | |
| Conservative | Sheila Jackson | 168 | 17.1 | −12.9 | |
| Labour | Callum Walsh | 164 | 16.7 | −22.9 | |
| Majority | 482 | 49.1 | |||
| Turnout | 982 | ||||
| Independent gain from Labour | Swing | ||||
| Party | Candidate | Votes | % | ±% | |
|---|---|---|---|---|---|
| Conservative | Emma Davis | 982 | 56.3 | +26.5 | |
| Liberal Democrats | Phil Barron | 594 | 34.1 | +18.8 | |
| Labour | Matthew Spoors | 168 | 9.6 | +9.6 | |
| Majority | 388 | 22.2 | |||
| Turnout | 1,744 | ||||
| Conservative gain from Independent | Swing | ||||
| Party | Candidate | Votes | % | ±% | |
|---|---|---|---|---|---|
| Labour | Mike Pringle | 962 | 64.9 | +0.6 | |
| Conservative | Kelly Fordham | 395 | 26.7 | −9.0 | |
| Independent | Jeremy Spry | 125 | 8.4 | +8.4 | |
| Majority | 567 | 38.3 | |||
| Turnout | 1,482 | ||||
| Labour hold | Swing | ||||
| Party | Candidate | Votes | % | ±% | |
|---|---|---|---|---|---|
| Labour | Andrew Freeman | 804 | 59.8 | +10.0 | |
| Conservative | Nigel Booth | 540 | 40.2 | −10.0 | |
| Majority | 264 | 19.6 | |||
| Turnout | 1,344 | ||||
| Labour gain from Conservative | Swing | ||||
References
[edit]- ^ a b "The Newark and Sherwood (Electoral Changes) Order 2014", legislation.gov.uk, The National Archives, SI 2014/1907, retrieved 20 August 2022
- ^ The District of Newark (Electoral Arrangements) Order 1976
- ^ The Leicestershire and Nottinghamshire (County and District Boundaries) Order 1985
- ^ legislation.gov.uk - The Nottinghamshire (District Boundaries) Order 1987. Retrieved on 6 November 2015.
- ^ legislation.gov.uk - The Lincolnshire and Nottinghamshire (County Boundaries) Order 1989. Retrieved on 5 November 2015.
- ^ "Local elections". BBC News Online. Retrieved 25 September 2009.
- ^ legislation.gov.uk - The District of Newark and Sherwood (Electoral Changes) Order 2000. Retrieved on 4 October 2015.
- ^ legislation.gov.uk - The District of Newark and Sherwood (Electoral Changes) Order 2007. Retrieved on 3 November 2015.
- ^ legislation.gov.uk - The District of Newark and Sherwood (Electoral Changes) (Amendment) Order 2007. Retrieved on 3 November 2015.
- ^ "Labour Win Key Election". Nottingham Evening Post. 12 September 2003.
- ^ "Tories Win By-Election". Nottingham Evening Post. 19 September 2003.
- ^ "Alarm over BNP near miss". guardian.co.uk. 4 March 2005. Retrieved 25 September 2009.
- ^ "Balderton West by-election result". Newark & Sherwood District Council. 22 July 2005. Archived from the original on 13 June 2011. Retrieved 25 September 2009.
- ^ "Edwinstowe newsletter 'not politically biased'". Hucknall Dispatch.co.uk. 10 June 2008. Retrieved 25 September 2009.
- ^ "Declaration of result of poll" (PDF). Newark & Sherwood District Council. Archived from the original (PDF) on 13 June 2011. Retrieved 30 July 2008.
- ^ "Clipstone by-election result". Mansfield Chad. 12 December 2008. Retrieved 25 September 2009.
- ^ "By election results". Newark & Sherwood District Council. 18 September 2009. Archived from the original on 13 June 2011. Retrieved 25 September 2009.
- ^ "Local Elections Archive Project — Rainworth Ward". www.andrewteale.me.uk. Retrieved 6 January 2024.
- ^ "Local Elections Archive Project — Lowdham Ward". www.andrewteale.me.uk. Retrieved 9 January 2024.
- ^ "Local Elections Archive Project — Collingham and Meering Ward". www.andrewteale.me.uk. Retrieved 9 January 2024.
- ^ "Local Elections Archive Project — Farnsfield and Bilsthorpe Ward". www.andrewteale.me.uk. Retrieved 9 January 2024.
- ^ "Local Elections Archive Project — Collingham and Meering Ward". www.andrewteale.me.uk. Retrieved 9 January 2024.
- ^ "Local Elections Archive Project — Ollerton Ward". www.andrewteale.me.uk. Retrieved 9 January 2024.
- ^ "Local Elections Archive Project — Balderton South Ward". www.andrewteale.me.uk. Retrieved 9 January 2024.
- ^ "Local Elections Archive Project — Ollerton Ward". www.andrewteale.me.uk. Retrieved 9 January 2024.
- ^ "Local Elections Archive Project — Boughton Ward". www.andrewteale.me.uk. Retrieved 9 January 2024.
- ^ "Local Elections Archive Project — Bridge Ward". www.andrewteale.me.uk. Retrieved 9 January 2024.
- ^ "Local Elections Archive Project — Rainworth South and Blidworth Ward". www.andrewteale.me.uk. Retrieved 9 January 2024.
- ^ "Local Elections Archive Project — Collingham Ward". www.andrewteale.me.uk. Retrieved 9 January 2024.
- ^ "Local Elections Archive Project — Ollerton Ward". www.andrewteale.me.uk. Retrieved 9 January 2024.
- ^ "Local Elections Archive Project — Edwinstowe and Clipstone Ward". www.andrewteale.me.uk. Retrieved 9 January 2024.