
Suffolk County Council elections
(Redirected from Suffolk local elections)
Suffolk County Council in England is elected every four years. Since the last boundary changes in 2005, 75 councillors have been elected from 75 wards.[1]
County Council composition[edit]
| Election | Conservative | Labour | Liberal Democrat | Green | UKIP | Other | Total | Notes |
|---|---|---|---|---|---|---|---|---|
| 1973 | 45 | 25 | 3 | - | - | 3 | 76 | |
| 1977 | 66 | 7 | 1 | - | - | 2 | 76 | |
| 1981 | 45 | 27 | 0 | - | - | 4 | 76 | |
| 1985 | 50 | 23 | 3 | - | - | 4 | 80 | Boundary changes increased the number of seats by 4[2] |
| 1989 | 46 | 26 | 4 | - | - | 4 | 80 | |
| 1993 | 26 | 31 | 19 | - | - | 4 | 80 | |
| 1997 | 31 | 34 | 14 | 0 | 0 | 1 | 80 | |
| 2001 | 31 | 36 | 12 | 0 | 0 | 1 | 80 | |
| 2005 | 45 | 22 | 7 | 0 | 0 | 1 | 75 | Boundary changes reduced the number of seats by 5[3] |
| 2009 | 55 | 4 | 11 | 2 | 1 | 2 | 75 | |
| 2013 | 39 | 15 | 7 | 2 | 9 | 3 | 75 | |
| 2017 | 52 | 11 | 5 | 3 | 0 | 4 | 75 | |
| 2021 | 55 | 5 | 4 | 9 | 0 | 2 | 75 | |
Composition since 1973[edit]
1973
1977
1981
1985
1989
1993
1997
2001
2005
2009
2013
2017
2021
County result maps[edit]
-
 2009 results map
 -
 2013 results map
 -
 2017 results map
 -
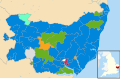 2021 results map


By-election results[edit]
1993-1997[edit]
| Party | Candidate | Votes | % | ±% | |
|---|---|---|---|---|---|
| Labour | 571 | 41.9 | |||
| Conservative | 554 | 40.6 | |||
| Liberal Democrats | 237 | 17.4 | |||
| Majority | 17 | 1.3 | |||
| Turnout | 1,362 | ||||
| Labour gain from Conservative | Swing | ||||
1997-2001[edit]
| Party | Candidate | Votes | % | ±% | |
|---|---|---|---|---|---|
| Labour | 569 | 51.5 | −1.5 | ||
| Conservative | 391 | 35.4 | +3.4 | ||
| Liberal Democrats | 144 | 13.0 | −2.0 | ||
| Majority | 178 | 16.1 | |||
| Turnout | 1,104 | ||||
| Labour hold | Swing | ||||
| Party | Candidate | Votes | % | ±% | |
|---|---|---|---|---|---|
| Liberal Democrats | David Wood | 1,193 | 66.3 | +1.2 | |
| Conservative | Stephen Williams | 504 | 28.0 | −6.8 | |
| Green | Anthony Slade | 102 | 5.7 | +5.7 | |
| Majority | 689 | 38.3 | |||
| Turnout | 1,799 | 31.0 | |||
| Liberal Democrats hold | Swing | ||||
2001-2005[edit]
| Party | Candidate | Votes | % | ±% | |
|---|---|---|---|---|---|
| Conservative | Jane Storey | 991 | 47.4 | +7.9 | |
| Liberal Democrats | Carol Milward | 982 | 47.0 | +8.5 | |
| Green | John Matthissen | 116 | 5.6 | +5.6 | |
| Majority | 9 | 0.4 | |||
| Turnout | 2,089 | 28.6 | |||
| Conservative hold | Swing | ||||
| Party | Candidate | Votes | % | ±% | |
|---|---|---|---|---|---|
| Labour | Kevan Lim | 819 | 53.6 | −0.6 | |
| Conservative | Anthony Ramsey | 369 | 24.3 | −0.5 | |
| Liberal Democrats | Robin Whitmore | 331 | 21.8 | +1.1 | |
| Majority | 450 | 29.6 | |||
| Turnout | 1,519 | 24.3 | |||
| Labour hold | Swing | ||||
| Party | Candidate | Votes | % | ±% | |
|---|---|---|---|---|---|
| Conservative | Janet Sibley | 645 | 38.0 | +4.3 | |
| Labour | Neil MacDonald | 588 | 34.6 | −14.2 | |
| Liberal Democrats | Robin Whitmore | 465 | 27.4 | +9.9 | |
| Majority | 57 | 3.4 | |||
| Turnout | 1,698 | 29.0 | |||
| Conservative gain from Labour | Swing | ||||
| Party | Candidate | Votes | % | ±% | |
|---|---|---|---|---|---|
| Conservative | Raeburn Leighton | 989 | 54.5 | +1.9 | |
| Liberal Democrats | Peter Perren | 716 | 39.4 | −8.0 | |
| Labour | Catherine Knight | 111 | 6.1 | +6.1 | |
| Majority | 273 | 15.1 | |||
| Turnout | 1,816 | 35.8 | |||
| Conservative hold | Swing | ||||
| Party | Candidate | Votes | % | ±% | |
|---|---|---|---|---|---|
| Conservative | Peter Bellfield | 1,114 | 50.9 | +7.2 | |
| Liberal Democrats | Ronald Else | 870 | 39.7 | +8.5 | |
| Labour | Valerie Pizzey | 206 | 9.4 | −15.8 | |
| Majority | 244 | 11.2 | |||
| Turnout | 2,190 | 31.2 | |||
| Conservative hold | Swing | ||||
| Party | Candidate | Votes | % | ±% | |
|---|---|---|---|---|---|
| Labour | William Quinton | 711 | 45.5 | −15.1 | |
| Conservative | Adam Ramsay | 463 | 29.4 | +4.3 | |
| Liberal Democrats | Catherine Chambers | 313 | 20.1 | +6.1 | |
| CPA | Jonathan Barnes | 74 | 4.7 | +4.7 | |
| Majority | 248 | 15.8 | |||
| Turnout | 1,561 | 24.5 | |||
| Labour hold | Swing | ||||
| Party | Candidate | Votes | % | ±% | |
|---|---|---|---|---|---|
| Conservative | Ann Rodwell | 1,401 | 65.5 | +12.9 | |
| Liberal Democrats | Cherrie MacGregor | 456 | 21.3 | +0.6 | |
| Labour | Harriet Bennett | 281 | 13.1 | −13.5 | |
| Majority | 945 | 44.2 | |||
| Turnout | 2,138 | 32.0 | |||
| Conservative hold | Swing | ||||
| Party | Candidate | Votes | % | ±% | |
|---|---|---|---|---|---|
| Conservative | Benjamin Redsell | 990 | 43.8 | +4.3 | |
| Liberal Democrats | Diana Ball | 867 | 38.3 | +9.9 | |
| Labour | Roy Burgon | 194 | 8.6 | −18.4 | |
| English Democrat | Robert Jay | 139 | 6.1 | +6.1 | |
| Green | Gordon Forbes | 71 | 3.1 | +3.1 | |
| Majority | 123 | 5.4 | |||
| Turnout | 2,261 | 32.0 | |||
| Conservative hold | Swing | ||||
2005-2009[edit]
| Party | Candidate | Votes | % | ±% | |
|---|---|---|---|---|---|
| Conservative | Anne Whybrow | 733 | 35.0 | +0.9 | |
| Liberal Democrats | Keith Scarff | 668 | 32.0 | +9.5 | |
| Green | Twiggy Davis | 354 | 16.9 | +4.7 | |
| Labour | Duncan Macpherson | 337 | 16.1 | −15.2 | |
| Majority | 65 | 3.0 | |||
| Turnout | 2,092 | 29.0 | |||
| Conservative hold | Swing | ||||
| Party | Candidate | Votes | % | ±% | |
|---|---|---|---|---|---|
| Conservative | Kenneth Sale | 1,338 | 36.5 | +2.8 | |
| Labour | Terence Kelly | 1,097 | 29.9 | −1.2 | |
| UKIP | Derek Hackett | 592 | 16.1 | +16.1 | |
| Liberal Democrats | Peter Guyton | 397 | 10.8 | −6.0 | |
| Green | Ann Skipper | 243 | 6.6 | −1.0 | |
| Majority | 241 | 6.6 | |||
| Turnout | 3,667 | 32.5 | |||
| Conservative gain from Labour | Swing | ||||
| Party | Candidate | Votes | % | ±% | |
|---|---|---|---|---|---|
| Conservative | Colin Noble | 1,222 | 61.5 | +20.7 | |
| UKIP | Ian Smith | 297 | 14.9 | +5.6 | |
| Labour | David Bowman | 219 | 11.0 | −11.1 | |
| Liberal Democrats | Tim Huggan | 118 | 5.9 | −7.1 | |
| Independent | David Chandler | 110 | 5.5 | −9.3 | |
| Independent | David Hitchman | 22 | 1.1 | +1.1 | |
| Majority | 925 | 46.6 | |||
| Turnout | 1,988 | 27.0 | |||
| Conservative hold | Swing | ||||
| Party | Candidate | Votes | % | ±% | |
|---|---|---|---|---|---|
| Liberal Democrats | Penny Otton | 927 | 41.8 | +7.5 | |
| Conservative | Julia Dunnicliffe | 833 | 37.5 | −9.4 | |
| Green | Cathy Cass | 287 | 12.9 | +12.9 | |
| Labour | Ron Snell | 88 | 4.0 | −14.8 | |
| UKIP | Chris Streatfield | 85 | 3.8 | +3.8 | |
| Majority | 94 | 4.3 | |||
| Turnout | 2,220 | 32.4 | |||
| Liberal Democrats gain from Conservative | Swing | ||||
| Party | Candidate | Votes | % | ±% | |
|---|---|---|---|---|---|
| Conservative | Gary Green | 834 | 38.8 | −0.7 | |
| Liberal Democrats | Nicky Turner | 781 | 36.3 | +18.1 | |
| Green | Nigel Rozier | 231 | 10.7 | +1.6 | |
| Labour | Duncan Macpherson | 190 | 8.8 | −24.5 | |
| UKIP | Christopher Streatfield | 114 | 5.3 | +5.3 | |
| Majority | 53 | 2.5 | |||
| Turnout | 2,150 | 27.0 | |||
| Conservative hold | Swing | ||||
| Party | Candidate | Votes | % | ±% | |
|---|---|---|---|---|---|
| Liberal Democrats | Caroline Page | 970 | 41.8 | +2.3 | |
| Conservative | Nigel Barratt | 826 | 35.6 | −4.4 | |
| Independent | Michael Weaver | 378 | 16.3 | +16.3 | |
| Labour | Roy Burgon | 147 | 6.3 | −14.2 | |
| Majority | 144 | 6.2 | |||
| Turnout | 2,321 | 37.2 | |||
| Liberal Democrats gain from Conservative | Swing | ||||
2009-2013[edit]
| Party | Candidate | Votes | % | ±% | |
|---|---|---|---|---|---|
| Conservative | Richard Smith | 2,240 | 45.5 | −2.0 | |
| Independent | Joan Girling | 1,439 | 29.2 | n/a | |
| Labour | Terry Hodgson | 1,243 | 25.3 | +12.1 | |
| Majority | 801 | 16.3 | −6.7 | ||
| Turnout | 5,009 | 66.2 | +26.2 | ||
| Conservative hold | Swing | ||||
| Party | Candidate | Votes | % | ±% | |
|---|---|---|---|---|---|
| Conservative | Stefan Oliver | 1,005 | 28.8 | 0.0 | |
| Independent | David Nettleton | 950 | 27.2 | +1.2 | |
| Labour | Kevin Hind | 759 | 21.7 | +12.6 | |
| Green | Pippa Judd | 479 | 13.7 | −13.4 | |
| Liberal Democrats | David Chappell | 300 | 8.6 | −0.4 | |
| Majority | 55 | ||||
| Turnout | 3,505 | 20.9 | |||
| Conservative hold | Swing | −0.6 | |||
| Party | Candidate | Votes | % | ±% | |
|---|---|---|---|---|---|
| Conservative | Andrew Reid | 1,913 | 55.2 | −5.4 | |
| Liberal Democrats | Christine Hancock | 796 | 23.0 | −7.2 | |
| Labour | Roy Burgon | 758 | 21.9 | +12.6 | |
| Majority | 1,117 | 32.2 | +1.8 | ||
| Turnout | 3,495 | 54.1 | +5.1 | ||
| Conservative hold | Swing | 0.9 | |||
| Party | Candidate | Votes | % | ±% | |
|---|---|---|---|---|---|
| Conservative | Christopher Hudson | 1,302 | 49.7 | −7.5 | |
| Labour | Kevin Archer | 804 | 30.7 | +16.7 | |
| Liberal Democrats | Derrick Fairbrother | 514 | 19.6 | −9.3 | |
| Majority | 498 | 19.0 | −9.3 | ||
| Turnout | 2639 | 17.1 | |||
| Conservative hold | Swing | −12.1 | |||
| Party | Candidate | Votes | % | ±% | |
|---|---|---|---|---|---|
| Conservative | Alan Murray | 866 | 43.8 | −11.3 | |
| Labour Co-op | John Cook | 566 | 28.6 | +15.0 | |
| UKIP | Chris Streatfield | 229 | 11.6 | +11.6 | |
| Green | Barry Broom | 189 | 9.6 | −4.4 | |
| Liberal Democrats | Peter Bagnall | 127 | 6.4 | −10.9 | |
| Majority | 300 | 15.1 | −22.7 | ||
| Turnout | 1988 | 35 | |||
| Conservative hold | Swing | −13.2 | |||
2013-2017[edit]
| Party | Candidate | Votes | % | ±% | |
|---|---|---|---|---|---|
| Conservative | Tim Marks | 3,001 | 38.9 | +4.5 | |
| UKIP | John Burns | 2,313 | 30.0 | +0.2 | |
| Labour | Maureen Byrne | 2,004 | 26.0 | +0.4 | |
| Liberal Democrats | Ken Rolph | 404 | 5.2 | −1.2 | |
| Majority | 1,117 | 8.9 | +4.3 | ||
| Turnout | 7,825 | 57.7 | |||
| Conservative hold | Swing | +2.2 | |||
| Party | Candidate | Votes | % | ±% | |
|---|---|---|---|---|---|
| Conservative | Robin Millar | 644 | 39.7 | −4.9 | |
| UKIP | Roger Dicker | 494 | 30.5 | +2.1 | |
| Labour | Michael Jefferys | 284 | 17.5 | −3.2 | |
| Independent | Andrew Appleby | 123 | 7.6 | +7.6 | |
| Liberal Democrats | Tim Huggan | 76 | 4.7 | −1.6 | |
| Majority | 150 | 9.2 | −7.0 | ||
| Turnout | 1,625 | 18.0 | |||
| Conservative hold | Swing | −3.5 | |||
| Party | Candidate | Votes | % | ±% | |
|---|---|---|---|---|---|
| Conservative | Paul West | 1,117 | 49.7 | −8.7 | |
| Labour | Rob Bridgeman | 634 | 28.2 | +3.5 | |
| UKIP | Tony Gould | 344 | 15.3 | +15.3 | |
| Liberal Democrats | Colin Boyd | 154 | 6.8 | +1.3 | |
| Majority | 300 | 21.5 | −12.2 | ||
| Turnout | 2,264 | 40.9 | |||
| Conservative hold | Swing | −6.1 | |||
| Party | Candidate | Votes | % | ±% | |
|---|---|---|---|---|---|
| UKIP | John Burns | 1,273 | 36.8 | +6.8 | |
| Conservative | Margaret Marks | 1,168 | 33.8 | −5.1 | |
| Labour | David Smith | 838 | 24.2 | −1.8 | |
| Liberal Democrats | Ken Rolph | 178 | 5.1 | −0.1 | |
| Majority | 105 | 2.8 | |||
| Turnout | 3,480 | 26.0 | |||
| UKIP gain from Conservative | Swing | +6.0 | |||
| Party | Candidate | Votes | % | ±% | |
|---|---|---|---|---|---|
| Conservative | Robin Vickery | 1,142 | 60.2 | +1.4 | |
| Labour | Revd Canon Graham Hedger | 344 | 18.2 | +4.1 | |
| Liberal Democrats | Jon Neal | 228 | 12.1 | +4.2 | |
| Green | Jacqueline Barrow | 228 | 9.3 | +9.3 | |
| Majority | 798 | 42.0 | +2.0 | ||
| Turnout | 1,895 | 27.4 | −10.6 | ||
| Conservative hold | Swing | −1.4 | |||
| Party | Candidate | Votes | % | ±% | |
|---|---|---|---|---|---|
| Liberal Democrats | Trevor Sheldrick | 642 | 36.2 | +12.0 | |
| Conservative | Kathryn Grandon-White | 460 | 25.9 | −5.6 | |
| Labour | Susan Monks | 397 | 22.4 | +5.8 | |
| UKIP | Stephen Laing | 204 | 11.5 | −11.3 | |
| Green | Lisa Gordon | 70 | 3.9 | −0.9 | |
| Majority | 182 | 10.3 | |||
| Turnout | 1,777 | 26.9 | |||
| Liberal Democrats gain from Conservative | Swing | +8.8 | |||
2017-2021[edit]
| Party | Candidate | Votes | % | ±% | |
|---|---|---|---|---|---|
| Labour | Sarah Adams | 1,247 | 62.9 | +5.3 | |
| Conservative | James Harding | 483 | 24.4 | −7.3 | |
| Liberal Democrats | Edward Packard | 200 | 10.1 | +5.1 | |
| Green | Charlotte Armstrong | 52 | 2.6 | −3.1 | |
| Majority | 764 | 38.5 | +12.6 | ||
| Turnout | 1,987 | 29.7 | −6.2 | ||
| Labour hold | Swing | +6.3 | |||
| Party | Candidate | Votes | % | ±% | |
|---|---|---|---|---|---|
| Conservative | Kay Oakes | 747 | 45.5 | −0.5 | |
| Liberal Democrats | Stephen Phillips | 726 | 44.2 | +5.5 | |
| Labour | Emma Bonner-Morgan | 168 | 10.2 | +2.9 | |
| Majority | 21 | 1.3 | −6.0 | ||
| Turnout | 1,647 | 21.3 | −11.4 | ||
| Conservative hold | Swing | −2.6 | |||
| Party | Candidate | Votes | % | ±% | |
|---|---|---|---|---|---|
| Conservative | Andrew Drummond | 893 | 50.3 | −0.2 | |
| Liberal Democrats | Jonathan Edge | 315 | 17.7 | +8.8 | |
| West Suffolk Independent | Andrew Appleby | 248 | 14.0 | +2.5 | |
| Labour | Theresa Chipulina | 198 | 11.1 | −4.5 | |
| Green | Alice Haycock | 123 | 6.9 | +6.9 | |
| Majority | 578 | 32.6 | −3.3 | ||
| Turnout | 1,783 | 17.2 | −8.4 | ||
| Conservative hold | Swing | −4.5 | |||
2021-2025[edit]
| Party | Candidate | Votes | % | ±% | |
|---|---|---|---|---|---|
| Green | Ash Lever | 2,114 | 70.5 | +18.5 | |
| Conservative | Letitia Smith | 624 | 20.8 | –19.7 | |
| Labour | Christian Newsome | 260 | 8.7 | +1.2 | |
| Majority | 1,490 | 49.7 | N/A | ||
| Turnout | 3,006 | 25.7 | –15.9 | ||
| Registered electors | 11,703 | ||||
| Green hold | Swing | ||||
| Party | Candidate | Votes | % | ±% | |
|---|---|---|---|---|---|
| Liberal Democrats | Seamus Bennett | 2,519 | 44.4 | +25.8 | |
| Conservative | Kevin Sullivan | 2,060 | 36.3 | –13.2 | |
| Green | Lesley Bennett | 939 | 16.6 | +5.5 | |
| Communist | Mark Jones | 150 | 2.6 | ±0.0 | |
| Majority | 459 | 8.1 | N/A | ||
| Turnout | 5,740 | 36.5 | -2.8 | ||
| Registered electors | 15,706 | ||||
| Liberal Democrats gain from Conservative | Swing | +19.5 | |||
| Party | Candidate | Votes | % | ±% | |
|---|---|---|---|---|---|
| Labour | Lucy Smith | 918 | 50.8 | +5.1 | |
| Conservative | Gregor McNie | 567 | 31.4 | –9.1 | |
| Green | Andy Patmore | 180 | 10.0 | +1.0 | |
| Liberal Democrats | Trevor Powell | 143 | 7.9 | +3.0 | |
| Majority | 351 | 19.4 | +14.2 | ||
| Turnout | 1,820 | 27.3 | |||
| Registered electors | 6,679 | ||||
| Labour hold | Swing | +7.1 | |||
| Party | Candidate | Votes | % | ±% | |
|---|---|---|---|---|---|
| Liberal Democrats | Ruth Leach | 990 | 51.2 | –12.3 | |
| Conservative | Alan Porter | 642 | 33.2 | –3.3 | |
| Labour | Paul Richards | 301 | 15.6 | N/A | |
| Majority | 348 | 18.0 | –9.0 | ||
| Turnout | 1,943 | 30.5 | –16.4 | ||
| Registered electors | 6,363 | ||||
| Liberal Democrats hold | Swing | -4.5 | |||
| Party | Candidate | Votes | % | ±% | |
|---|---|---|---|---|---|
| Labour | |||||
| Conservative | |||||
| Liberal Democrats | |||||
| Green | |||||
| Majority | |||||
| Turnout | |||||
| Registered electors | |||||
References[edit]
- ^ "County Councillors". Suffolk County Council. Archived from the original on 24 February 2012. Retrieved 18 March 2010.
- ^ The County of Suffolk (Electoral Arrangements) Order 1984
- ^ "Local election results: Suffolk". BBC News Online. Archived from the original on 19 October 2006. Retrieved 18 March 2010.
- ^ "Past election results" (PDF). Babergh District Council. Archived from the original (PDF) on 22 July 2011. Retrieved 18 March 2010.
- ^ a b c d "Thedwastre South" (PDF). Suffolk County Council. Archived from the original (PDF) on 24 February 2012. Retrieved 18 March 2010.
- ^ a b "Wickham" (PDF). Suffolk County Council. Archived from the original (PDF) on 24 February 2012. Retrieved 18 March 2010.
- ^ "Liberal Democrats win Yoxford by-election" (PDF). Suffolk Coastal District Council. 6 February 2004. Archived from the original (PDF) on 13 June 2011. Retrieved 18 March 2010.
- ^ "Conservatives hold Felxstowe South seat" (PDF). Suffolk Coastal District Council. 23 April 2004. Archived from the original (PDF) on 14 June 2011. Retrieved 18 March 2010.
- ^ "Stowmarket South by-election results". Suffolk County Council. Retrieved 18 March 2010.[permanent dead link]
- ^ "Greens build on election success". guardian.co.uk. London. 12 May 2006. Archived from the original on 10 May 2017. Retrieved 18 March 2010.
- ^ "Pakefield by-election results". Suffolk County Council. Retrieved 18 March 2010.[permanent dead link]
- ^ "Row Heath by-election results". Suffolk County Council. Archived from the original on 15 July 2006. Retrieved 18 March 2010.
- ^ "Lib Dems snatch shock win in council by-election". 24dash.com. 24 August 2007. Archived from the original on 29 February 2012. Retrieved 18 March 2010.
- ^ "Thedwastre South By-election Results". Suffolk County Council. Retrieved 18 March 2010. [permanent dead link]
- ^ "Stowmarket North and Stowupland by-election results 2008". Suffolk County Council. Retrieved 18 March 2010.[permanent dead link]
- ^ "19 September 2008 - Woodbridge by-election". Suffolk County Council. Retrieved 25 September 2008. [dead link]
- ^ "Aldeburgh and Leiston by-election results". Suffolk County Council. Retrieved 28 July 2011.[permanent dead link]
- ^ "Tower by-election results". Suffolk County Council. Archived from the original on 24 December 2018. Retrieved 16 May 2016.
- ^ "Wilford by-election results". Suffolk County Council. Retrieved 28 July 2011.[permanent dead link]
- ^ a b "By-Election Results in 2012". Suffolk County Council. Archived from the original on 31 August 2012. Retrieved 4 March 2013.
- ^ a b "Haverhill Cangle by-election results". Suffolk County Council. Archived from the original on 24 December 2018. Retrieved 16 May 2016.
- ^ "Newmarket and Red Lodge by-election results". Suffolk County Council. Archived from the original on 24 December 2018. Retrieved 16 May 2016.
- ^ "Bixley By-election Results 2016". Suffolk County Council. Archived from the original on 24 December 2018. Retrieved 16 May 2016.
- ^ https://www.suffolk.gov.uk/assets/council-and-democracy/consultations-petitions-and-elections/2016-09-23-Hadleigh-Declaration-of-results.pdf [bare URL PDF] [dead link]
- ^ "Declaration of Result - Beccles Division" (PDF). Archived (PDF) from the original on 10 March 2023. Retrieved 10 March 2023.
- ^ "Notice of election Pakefield May 2024" (PDF). suffolk.gov.uk. Suffolk County Council. 30 May 2024. Retrieved 31 May 2024.