Bifurcation diagram
In mathematics, particularly in dynamical systems, a bifurcation diagram shows the possible long-term values (equilibria/fixed points or periodic orbits) of a system as a function of a bifurcation parameter in the system. It is usual to represent stable solutions with a solid line and unstable solutions with a dotted line.
Bifurcations in 1D discrete dynamical systems
Logistic map


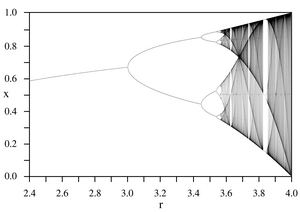
An example is the bifurcation diagram of the logistic map:
The bifurcation parameter r is shown on the horizontal axis of the plot and the vertical axis shows the possible long-term population values of the logistic function. Only the stable solutions are shown here, there are many other unstable solutions which are not shown in this diagram.
The bifurcation diagram nicely shows the forking of the possible periods of stable orbits from 1 to 2 to 4 to 8 etc. Each of these bifurcation points is a period-doubling bifurcation. The ratio of the lengths of successive intervals between values of r for which bifurcation occurs converges to the first Feigenbaum constant.
Real quadratic map
The map is .
Symmetry breaking in bifurcation sets

In a dynamical system such as
- ,
which is structurally stable when , if a bifurcation diagram is plotted, treating as the bifurcation parameter, but for different values of , the case is the symmetric pitchfork bifurcation. When , we say we have a pitchfork with broken symmetry. This is illustrated in the animation on the right.
See also
References
- Paul Glendinning, "Stability, Instability and Chaos", Cambridge University Press, 1994.
- Steven Strogatz, "Non-linear Dynamics and Chaos: With applications to Physics, Biology, Chemistry and Engineering", Perseus Books, 2000.
External links
- Logistic Map Simulation. A Java applet simulating the Logistic Map by Yuval Baror.
- The Logistic Map and Chaos


