Frequency-resolved optical gating: Difference between revisions
m Section capitalization |
|||
| Line 47: | Line 47: | ||
The retrieved FROG trace is created synthetically from the best guess for <math>E(t)</math>. |
The retrieved FROG trace is created synthetically from the best guess for <math>E(t)</math>. |
||
== |
==FROG algorithm== |
||
[[Image:FS_FROG_Life_Cycle.png|thumb|right|300px|The FROG algorithm "life cycle."]] |
[[Image:FS_FROG_Life_Cycle.png|thumb|right|300px|The FROG algorithm "life cycle."]] |
||
| Line 71: | Line 71: | ||
so the amplitude of <math>\tilde{E}_{sig}(\omega,\tau)</math> is known, but not its phase. |
so the amplitude of <math>\tilde{E}_{sig}(\omega,\tau)</math> is known, but not its phase. |
||
==Competing |
==Competing techniques== |
||
*[[Spectral interferometry for direct electric field reconstruction]] |
*[[Spectral interferometry for direct electric field reconstruction]] |
||
== |
==Further reading== |
||
*{{book reference|Title=Frequency-Resolved Optical Gating: The Measurement of Ultrashort Laser Pulses|ID=ISBN 1-4020-7066-7|Author=Rick Trebino|Publisher=Springer|Year= 2002}} |
*{{book reference|Title=Frequency-Resolved Optical Gating: The Measurement of Ultrashort Laser Pulses|ID=ISBN 1-4020-7066-7|Author=Rick Trebino|Publisher=Springer|Year= 2002}} |
||
Revision as of 19:34, 20 December 2005
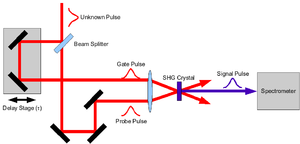
In optics, frequency-resolved optical gating (FROG) is a derivative of autocorrelation, but is far superior in its ability to measure ultrafast optical pulse shapes. In the most common configuration, FROG is simply a background-free autocorrelator followed by a spectrometer. It is the two-dimensional nature of the FROG trace that allows the extraction of the actual pulse shape from the data.
The basics
Mathematically the FROG trace is simply a spectrogram but with an unknown gate function:
where is the "probe" pulse and is the "gate" pulse. The prope and gate pulses are determined by the nonlinear interaction used, and it is the form of the probe and gate that distinguishes the different types of FROG from each other. Some of the most common are:
| : Second-harmonic generation FROG | ||
| : Polarization gating FROG | ||
| : Self-diffraction FROG | ||
| : Third-harmonic generation FROG |

For example second-harmonic generation FROG (SHG FROG) would be:
and PG FROG would be:
Traditional inversion algorithms for spectrograms requires perfect knowledge of the gate function (), however, FROG does not have this luxury. Instead an interative alogrithm is used. The algorithm uses both the data (FROG trace) and form of the nonlinearity to achieve a best match between the real FROG trace and the "retrieved" FROG trace. The retrieved FROG trace is created synthetically from the best guess for .
FROG algorithm

The FROG algorithm is all about phase retrieval. The FROG trace measured in the lab is the exact intensity of ; however, it is missing the phase information. To start off with define a signal field:
and further defining:
given this the FROG trace becomes:
inverting this:
so the amplitude of is known, but not its phase.
Competing techniques
Further reading
- . ISBN 1-4020-7066-7.
{{cite book}}: Missing or empty|title=(help); Unknown parameter|Author=ignored (|author=suggested) (help); Unknown parameter|Publisher=ignored (|publisher=suggested) (help); Unknown parameter|Title=ignored (|title=suggested) (help); Unknown parameter|Year=ignored (|year=suggested) (help)
External links
- FROG Page by Rick Trebino (the inventor of FROG)


