Gel electrophoresis: Difference between revisions
No edit summary |
No edit summary |
||
| Line 111: | Line 111: | ||
[[ur:ھلامہ برقی رحلان]] |
[[ur:ھلامہ برقی رحلان]] |
||
[[zh:凝膠電泳]] |
[[zh:凝膠電泳]] |
||
[[fr:Électrophorèse_sur_gel]] |
|||
Revision as of 04:38, 17 October 2011
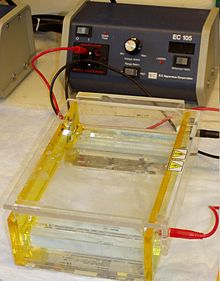
 Gel electrophoresis apparatus – An agarose gel is placed in this buffer-filled box and electrical field is applied via the power supply to the rear. The negative terminal is at the far end (black wire), so DNA migrates toward the camera. | |
| Classification | Electrophoresis |
|---|---|
| Other techniques | |
| Related | Capillary electrophoresis SDS-PAGE Two-dimensional gel electrophoresis Temperature gradient gel electrophoresis |
Gel electrophoresis refers to using a gel as an anticonvective medium and or sieving medium during electrophoresis. Gel electrophoresis is most commonly used for separation of biological macromolecules such as deoxyribonucleic acid (DNA), ribonucleic acid (RNA), or protein; however, gel electrophoresis can be used for separation of nanoparticles. Electrophoresis refers to the movement of a charged particle in an electrical field. Gels suppress the thermal convection caused by application of the electric field, and can also act as a sieving medium, retarding the passage of molecules; gels can also simply serve to maintain the finished separation, so that a post electrophoresis stain can be applied.[1] DNA Gel electrophoresis is usually performed for analytical purposes, often after amplification of DNA via PCR, but may be used as a preparative technique prior to use of other methods such as mass spectrometry, RFLP, PCR, cloning, DNA sequencing, or Southern blotting for further characterization.
Separation
In simple terms: Electrophoresis is a procedure which enables the sorting of molecules based on size and charge. Using an electric field, molecules (such as DNA) can be made to move through a gel made of agar. The molecules being sorted are dispensed into a well in the gel material. The gel is placed in an electrophoresis chamber, which is then connected to a power source. When the electric current is applied, the larger molecules move more slowly through the gel while the smaller molecules move faster. The different sized molecules form distinct bands on the gel.[citation needed]
The term "gel" in this instance refers to the matrix used to contain, then separate the target molecules. In most cases, the gel is a crosslinked polymer whose composition and porosity is chosen based on the specific weight and composition of the target to be analyzed. When separating proteins or small nucleic acids (DNA, RNA, or oligonucleotides) the gel is usually composed of different concentrations of acrylamide and a cross-linker, producing different sized mesh networks of polyacrylamide. When separating larger nucleic acids (greater than a few hundred bases), the preferred matrix is purified agarose. In both cases, the gel forms a solid, yet porous matrix. Acrylamide, in contrast to polyacrylamide, is a neurotoxin and must be handled using appropriate safety precautions to avoid poisoning. Agarose is composed of long unbranched chains of uncharged carbohydrate without cross links resulting in a gel with large pores allowing for the separation of macromolecules and macromolecular complexes.[citation needed]
"Electrophoresis" refers to the electromotive force (EMF) that is used to move the molecules through the gel matrix. By placing the molecules in wells in the gel and applying an electric field, the molecules will move through the matrix at different rates, determined largely by their mass when the charge to mass ratio (Z) of all species is uniform, toward the anode if negatively charged or toward the cathode if positively charged.[2]
Visualization

After the electrophoresis is complete, the molecules in the gel can be stained to make them visible. DNA may be visualized using ethidium bromide which, when intercalated into DNA, fluoresce under ultraviolet light, while protein may be visualised using silver stain or Coomassie Brilliant Blue dye. Other methods may also be used to visualize the separation of the mixture's components on the gel. If the molecules to be separated contain radioactivity, for example in DNA sequencing gel, an autoradiogram can be recorded of the gel.[citation needed] Photograph can be taken of gels, often using Gel Doc.
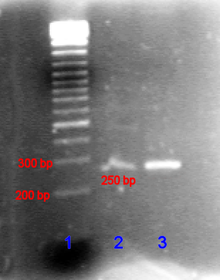
If several samples have been loaded into adjacent wells in the gel, they will run parallel in individual lanes. Depending on the number of different molecules, each lane shows separation of the components from the original mixture as one or more distinct bands, one band per component. Incomplete separation of the components can lead to overlapping bands, or to indistinguishable smears representing multiple unresolved components.[citation needed]
Bands in different lanes that end up at the same distance from the top contain molecules that passed through the gel with the same speed, which usually means they are approximately the same size. There are molecular weight size markers available that contain a mixture of molecules of known sizes. If such a marker was run on one lane in the gel parallel to the unknown samples, the bands observed can be compared to those of the unknown in order to determine their size. The distance a band travels is approximately inversely proportional to the logarithm of the size of the molecule.[citation needed]
Applications
Gel electrophoresis is used in forensics, molecular biology, genetics, microbiology and biochemistry. The results can be analyzed quantitatively by visualizing the gel with UV light and a gel imaging device. The image is recorded with a computer operated camera, and the intensity of the band or spot of interest is measured and compared against standard or markers loaded on the same gel. The measurement and analysis are mostly done with specialized software.
Depending on the type of analysis being performed, other techniques are often implemented in conjunction with the results of gel electrophoresis, providing a wide range of field-specific applications.
Nucleic acids

In the case of nucleic acids, the direction of migration, from negative to positive electrodes, is due to the naturally-occurring negative charge carried by their sugar-phosphate backbone.[3]
Double-stranded DNA fragments naturally behave as long rods, so their migration through the gel is relative to their size or, for cyclic fragments, their radius of gyration. Circular DNA such as plasmids, however, may show multiple bands, the speed of migrate may depend on whether it is relaxed or supercoiled. Single-stranded DNA or RNA tend to fold up into molecules with complex shapes and migrate through the gel in a complicated manner based on their tertiary structure. Therefore, agents that disrupt the hydrogen bonds, such as sodium hydroxide or formamide, are used to denature the nucleic acids and cause them to behave as long rods again.[4]
Gel electrophoresis of large DNA or RNA is usually done by agarose gel electrophoresis. See the "Chain termination method" page for an example of a polyacrylamide DNA sequencing gel. Characterization through ligand interaction of nucleic acids or fragments may be performed by mobility shift affinity electrophoresis.
Electrophoresis of RNA samples can be used to check for genomic DNA contamination and also for RNA degradation. RNA from eukaryotic organisms shows distinct bands of 28s and 18s rRNA, the 28s band being approximately twice as intense as the 18s band. Degraded RNA has less sharpely defined bands, has a smeared appearance, and intensity ratio is less than 2:1.
Proteins

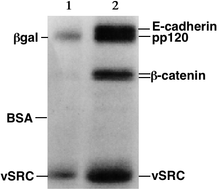
Proteins, unlike nucleic acids, can have varying charges and complex shapes, therefore they may not migrate into the polyacrylamide gel at similar rates, or at all, when placing a negative to positive EMF on the sample. Proteins therefore, are usually denatured in the presence of a detergent such as sodium dodecyl sulfate/sodium dodecyl phosphate (SDS/SDP) that coats the proteins with a negative charge.[1] Generally, the amount of SDS bound is relative to the size of the protein (usually 1.4g SDS per gram of protein), so that the resulting denatured proteins have an overall negative charge, and all the proteins have a similar charge to mass ratio. Since denatured proteins act like long rods instead of having a complex tertiary shape, the rate at which the resulting SDS coated proteins migrate in the gel is relative only to its size and not its charge or shape.[1]
Proteins are usually analyzed by sodium dodecyl sulfate polyacrylamide gel electrophoresis (SDS-PAGE), by native gel electrophoresis, by quantitative preparative native continuous polyacrylamide gel electrophoresis (QPNC-PAGE), or by 2-D electrophoresis.
Characterization through ligand interaction may be performed by electroblotting or by affinity electrophoresis in agarose or by capillary electrophoresis as for estimation of binding constants and determination of structural features like glycan content through lectin binding.
History
- 1930s – first reports of the use of sucrose for gel electrophoresis
- 1955 – introduction of starch gels, mediocre separation
- 1959 – introduction of acrylamide gels; disc electrophoresis (Ornstein and Davis); accurate control of parameters such as pore size and stability; and (Raymond and Weintraub)
- 1969 – introduction of denaturing agents especially SDS separation of protein subunit (Weber and Osborn)[5]
- 1970 – Laemmli separated 28 components of T4 phage using a stacking gel and SDS
- 1975 – 2-dimensional gels (O’Farrell); isoelectric focusing then SDS gel electrophoresis
- 1977 – sequencing gels
- late 1970s – agarose gels
- 1983 – pulsed field gel electrophoresis enables separation of large DNA molecules
- 1983 – introduction of capillary electrophoresis
A 1959 book on electrophoresis by Milan Bier cites references from the 1800s.[6] However, Oliver Smithies made significant contributions. Bier states: "The method of Smithies ... is finding wide application because of its unique separatory power." Taken in context, Bier clearly implies that Smithies' method is an improvement.
See also
References
- ^ a b c Berg JM, Tymoczko JL Stryer L (2002). Biochemistry (5th ed.). WH Freeman. ISBN 0-7167-4955-6.
- ^ Robyt, John F. & White, Bernard J. (1990). Biochemical Techniques Theory and Practice. Waveland Press. ISBN 0-88133-556-8.
{{cite book}}: CS1 maint: multiple names: authors list (link) - ^ Lodish H, Berk A, Matsudaira P; et al. (2004). Molecular Cell Biology (5th ed.). WH Freeman: New York, NY. ISBN 978-0716743668.
{{cite book}}: Explicit use of et al. in:|author=(help)CS1 maint: multiple names: authors list (link) - ^ Troubleshooting DNA agarose gel electrophoresis. Focus 19:3 p.66 (1997).
- ^ Weber, K; Osborn, M (1969). "The reliability of molecular weight determinations by dodecyl sulfate-polyacrylamide gel electrophoresis". The Journal of biological chemistry. 244 (16): 4406–12. PMID 5806584.
- ^ Milan Bier (ed.) (1959). Electrophoresis. Theory, Methods and Applications (3rd printing ed.). Academic Press. p. 225. OCLC 1175404. LCC 59-7676.
{{cite book}}:|author=has generic name (help)
External links
- Biotechniques Laboratory electrophoresis demonstration, from the University of Utah's Genetic Science Learning Center
- Discontinuous native protein gel electrophoresis
- Drinking straw electrophoresis
