User:SushiGod/sandbox/2004
Appearance
< User:SushiGod | sandbox
| |||||||||||||||||||||||||||||
538 members of the Electoral College 270 electoral votes needed to win | |||||||||||||||||||||||||||||
|---|---|---|---|---|---|---|---|---|---|---|---|---|---|---|---|---|---|---|---|---|---|---|---|---|---|---|---|---|---|
| Turnout | 57.4%[1] | ||||||||||||||||||||||||||||
| |||||||||||||||||||||||||||||
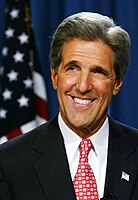
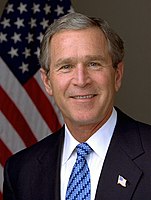
 Presidential election results map. Blue denotes states won by Dean/Graham and red denotes those won by Bush/Frist. Numbers indicate electoral votes cast by each state and the District of Columbia. | |||||||||||||||||||||||||||||
| |||||||||||||||||||||||||||||
| Category 5 major hurricane (SSHWS/NWS) | |
 Hurricane Lisa at peak intensity nearing landfall in Louisiana on September 6 | |
| Formed | August 30, 2004 |
|---|---|
| Dissipated | September 10, 2004 |
| (Extratropical after September 7) | |
| Highest winds | 1-minute sustained: 180 mph (285 km/h) |
| Lowest pressure | 905 mbar (hPa); 26.72 inHg |
| Fatalities | 2,712 total |
| Damage | $132 billion (2004 USD) (Fourth-costliest tropical cyclone on record[2]) |
| Areas affected |
|
| Part of the 2004 Atlantic hurricane season | |
- ^ "Voter Turnout in Presidential Elections". Presidency.ucsb.edu. Retrieved 2016-08-18.
- ^ Costliest U.S. tropical cyclones tables update (PDF) (Report). United States National Hurricane Center. January 12, 2018. Archived (PDF) from the original on January 27, 2018. Retrieved January 12, 2018.


