
Sequence diagram
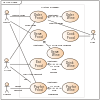
A sequence diagram (also called interaction diagram) is a UML construct of a Message Sequence Chart. It shows how processes operate one with another and in what order. A sequence diagram shows, as parallel vertical lines, different processes or objects that live simultaneously, and, as horizontal arrows, the messages exchanged between them, in the order in which they occur. This allows the specification of simple runtime scenarios in a graphical manner.
-->If the lifeline is that of an object, it is underlined (if not it is a role). Note that leaving the instance name blank can represent anonymous and unnamed instances.
In order to display interaction, messages are used. These are horizontal arrows with the message name written above them. Solid arrows with full heads are synchronous calls, solid arrows with stick heads are asynchronous calls and dashed arrows with stick heads are return messages. This definition is true as of UML 2, considerably different from UML 1.x.
Activation boxes, or method-call boxes, are opaque rectangles drawn on top of lifelines to represent that processes are being performed in response to the message.
Objects calling methods on themselves use messages and add new activation boxes on top of any others to indicate a further level of processing.
When an object is destroyed (removed from memory), an X is drawn on top of the lifeline, and the dashed line ceases to be drawn below it (this is not the case in the first example though). It should be the result of a message, either from the object itself, or another.
A message sent from outside the diagram can be represented by a message originating from a filled-in circle.
A UML diagram may perform a series of steps, called a superstep, in response to only one external stimulus.
Usage and limitations
Some systems have simple dynamic behavior that can be expressed in terms of specific sequences of messages between a small, fixed number of objects or processes. In such cases sequence diagrams can completely specify the system's behavior. Often, behavior is more complex, e.g. when the set of communicating objects is large or highly variable, when there are many branch points (e.g. exceptions), when there are complex iterations, or synchronization issues such as resource contention. In such cases, sequence diagrams cannot completely describe the system's behavior, but they can specify typical use cases for the system, small details in its behavior, and simplified overviews of its behavior.
External links
- Introduction to UML 2 Sequence Diagrams by Scott W. Ambler.
- UML 2 Sequence Diagram Guidelines by Scott W. Ambler.
- UML's Sequence Diagram by Donald Bell
- A simple SD editor
- Web-based Sequence Diagram Generator
- A Quick Introduction to UML Sequence Diagrams by Yanic Inghelbrecht
- Trace Modeler : Smart editor for UML sequence diagrams, combines automatic layout with a simple drag & drop interface
- A gallery with many examples of UML sequence diagrams
- Flowchart4j - Generates Sequence diagram from Java code, also exports to Microsoft Visio as UML Model Diagram. User comment: the free version is very limited.You will not be able to draw a decent graph.
- EventStudio: Generate Sequence Diagrams from Text Based Model User comment: you have to manually generate the diagrams.
- MaintainJ - Eclipse plugin to generate runtime sequence diagrams for a use case for any Java application.
- Dynamic Sequence Diagram Viewer: Generate and update (via XML) real time animated dynamic sequence diagrams within a web page by Richard Jewson. User comment: it does not seem to work.Only a demo is available.
| Actors |
|  | |||||||||||
|---|---|---|---|---|---|---|---|---|---|---|---|---|---|
| Concepts |
| ||||||||||||
| Diagrams |
| ||||||||||||
| Derived languages | |||||||||||||
| Other topics | |||||||||||||
Deepak Sharma, Noida