
File:2012 Pacific typhoon season summary.png

Size of this preview: 800 × 600 pixels. Other resolutions: 320 × 240 pixels | 640 × 480 pixels | 1,024 × 768 pixels | 1,280 × 960 pixels | 2,560 × 1,920 pixels | 4,000 × 3,000 pixels.
Original file (4,000 × 3,000 pixels, file size: 7.67 MB, MIME type: image/png)
| This is a file from the Wikimedia Commons. Information from its description page there is shown below. Commons is a freely licensed media file repository. You can help. |
| Description |
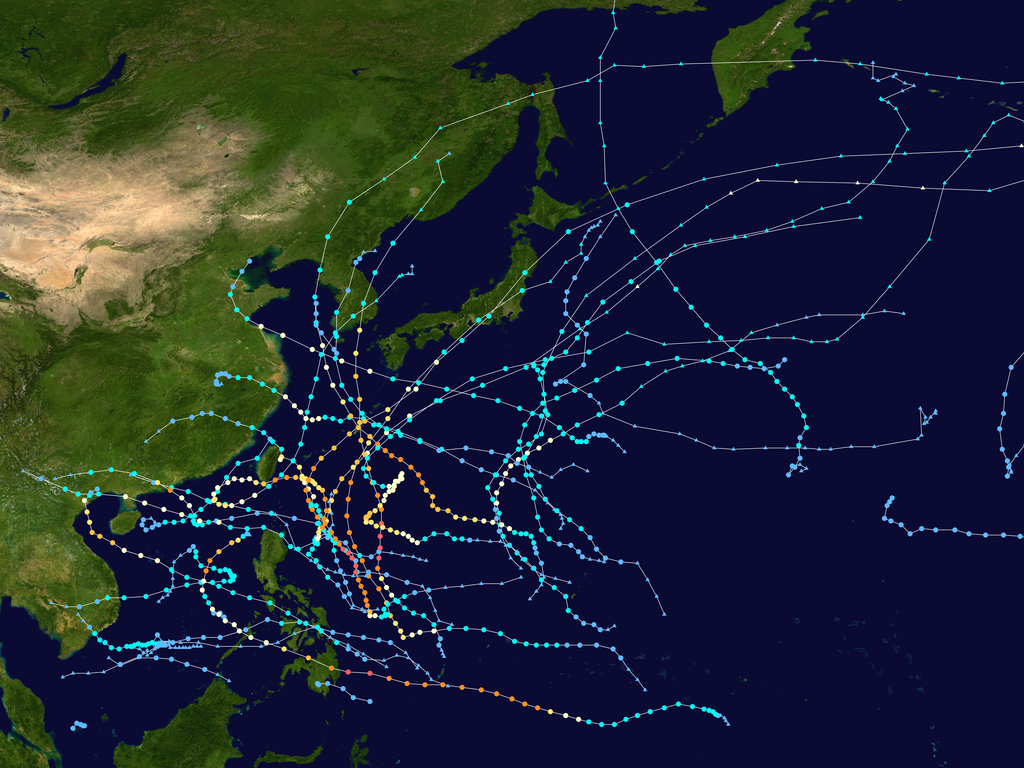
English: This map shows the tracks of all tropical cyclones in the 2012 Pacific typhoon season. The points show the location of each storm at 6-hour intervals. The colour represents the storm's maximum sustained wind speeds as classified in the Saffir-Simpson Hurricane Scale (see below), and the shape of the data points represent the type of the storm.
Tropical depression (≤38 mph, ≤62 km/h)
Tropical storm (39–73 mph, 63–118 km/h)
Category 1 (74–95 mph, 119–153 km/h)
Category 2 (96–110 mph, 154–177 km/h)
Category 3 (111–129 mph, 178–208 km/h)
Category 4 (130–156 mph, 209–251 km/h)
Category 5 (≥157 mph, ≥252 km/h)
Unknown
Storm type |
| Source | Created using Wikipedia:WikiProject Tropical cyclones/Tracks. The background image is from NASA [1]. The tracking data is from the Joint Typhoon Warning Center's best track database |
| Author | Cyclonebiskit |
| This work has been released into the public domain by its author, Cyclonebiskit. This applies worldwide. In some countries this may not be legally possible; if so: Cyclonebiskit grants anyone the right to use this work for any purpose, without any conditions, unless such conditions are required by law. |
File history
Click on a date/time to view the file as it appeared at that time.
| Date/Time | Thumbnail | Dimensions | User | Comment | |
|---|---|---|---|---|---|
| 08:21, 1 July 2012 |  | 3,000 × 1,875 (3.23 MB) | Keith Edkins | Added Doksuri | |
| 12:11, 21 June 2012 |  | 3,000 × 1,875 (3.2 MB) | Keith Edkins | Completing Guchol and add Talim | |
| 14:09, 18 June 2012 |  | 3,000 × 1,854 (2.37 MB) | Cyclonebiskit | update | |
| 08:40, 7 June 2012 |  | 3,000 × 1,875 (3.14 MB) | Keith Edkins | Added Mawar | |
| 09:51, 28 May 2012 |  | 3,000 × 1,875 (3.12 MB) | Keith Edkins | Added Sanvu | |
| 09:02, 1 May 2012 |  | 3,000 × 1,875 (3.08 MB) | Keith Edkins | Added a Tropical Depression | |
| 07:37, 12 April 2012 |  | 3,000 × 1,875 (3.07 MB) | Keith Edkins | Add JMA Tropical Depression 4 | |
| 10:51, 4 April 2012 |  | 3,000 × 1,875 (3.07 MB) | Keith Edkins | Updated | |
| 09:12, 22 February 2012 |  | 3,000 × 1,875 (3.06 MB) | Keith Edkins | Add 01W | |
| 12:31, 20 January 2012 |  | 3,000 × 1,875 (3.06 MB) | Keith Edkins | == {{int:filedesc}} == {{Information |Description={{en|Track map of all storms in the 2012 Pacific typhoon season The points show the location of the storm at 6-hour intervals. The colour represents the storm's [[:w:maxim |
File usage
The following pages on the English Wikipedia use this file (pages on other projects are not listed):
- 2012 Pacific typhoon season
- Timeline of the 2012 Pacific typhoon season
- Tropical Storm Khanun (2012)
- Tropical Storm Pakhar (2012)
- Typhoon Bolaven (2012)
- Typhoon Bopha
- Typhoon Damrey (2012)
- Typhoon Guchol (2012)
- Typhoon Haikui (2012)
- Typhoon Jelawat (2012)
- Typhoon Kai-tak (2012)
- Typhoon Sanba
- Typhoon Saola (2012)
- Typhoon Son-Tinh
- Typhoon Tembin (2012)
- Typhoon Vicente
- User:Cyclonebiskit/Sandbox2
- User:Nino Marakot/2012 Pacific typhoon season
- User:Tfmbty/2012 Pacific typhoon season
- Template:2012 Pacific typhoon season buttons
Global file usage
The following other wikis use this file:
- Usage on de.wikipedia.org
- Usage on ja.wikipedia.org
- Usage on ko.wikipedia.org
- Usage on nl.wikipedia.org
- Usage on pt.wikipedia.org
- Usage on th.wikipedia.org
- Usage on tl.wikipedia.org
- Usage on uk.wikipedia.org
- Usage on vi.wikipedia.org
- Usage on www.wikidata.org
- Usage on zh.wikipedia.org
- User:Msnhinet8jp/2012年太平洋颱風季
- 2012年太平洋颱風季
- Template:2012年太平洋颱風季
- 熱帶風暴帕卡 (2012年)
- Portal:太平洋颱風季/2012年太平洋颱風季
- 強烈熱帶風暴珊瑚 (2012年)
- 颱風瑪娃 (2012年)
- 颱風古超 (2012年)
- 強烈熱帶風暴泰利 (2012年)
- 熱帶風暴杜蘇芮 (2012年)
- 強烈熱帶風暴卡努 (2012年)
- 颱風韋森特 (2012年)
- 颱風蘇拉 (2012年)
- 颱風達維 (2012年)
- 颱風海葵 (2012年)
- 颱風啟德 (2012年)
- 颱風天秤 (2012年)
- 颱風布拉萬 (2012年)
- 強烈熱帶風暴奇洛基 (2012年)
- 颱風三巴 (2012年)
- 颱風杰拉華 (2012年)
- 強烈熱帶風暴艾雲尼 (2012年)
- 強烈熱帶風暴馬力斯 (2012年)
- 強烈熱帶風暴格美 (2012年)
- 颱風派比安 (2012年)
- 颱風山神 (2012年)
View more global usage of this file.