
File:Europe-GDP-PPP-per-capita-map.png

Size of this preview: 784 × 599 pixels. Other resolutions: 314 × 240 pixels | 628 × 480 pixels | 1,005 × 768 pixels | 1,280 × 979 pixels | 2,560 × 1,957 pixels.
Original file (2,560 × 1,957 pixels, file size: 568 KB, MIME type: image/png)
| This is a file from the Wikimedia Commons. Information from its description page there is shown below. Commons is a freely licensed media file repository. You can help. |

|
This economic map image could be re-created using vector graphics as an SVG file. This has several advantages; see Commons:Media for cleanup for more information. If an SVG form of this image is available, please upload it and afterwards replace this template with
{{vector version available|new image name}}.
It is recommended to name the SVG file “Europe-GDP-PPP-per-capita-map.svg”—then the template Vector version available (or Vva) does not need the new image name parameter. |
| I, the copyright holder of this work, release this work into the public domain. This applies worldwide. In some countries this may not be legally possible; if so: I grant anyone the right to use this work for any purpose, without any conditions, unless such conditions are required by law. |
Created by me.
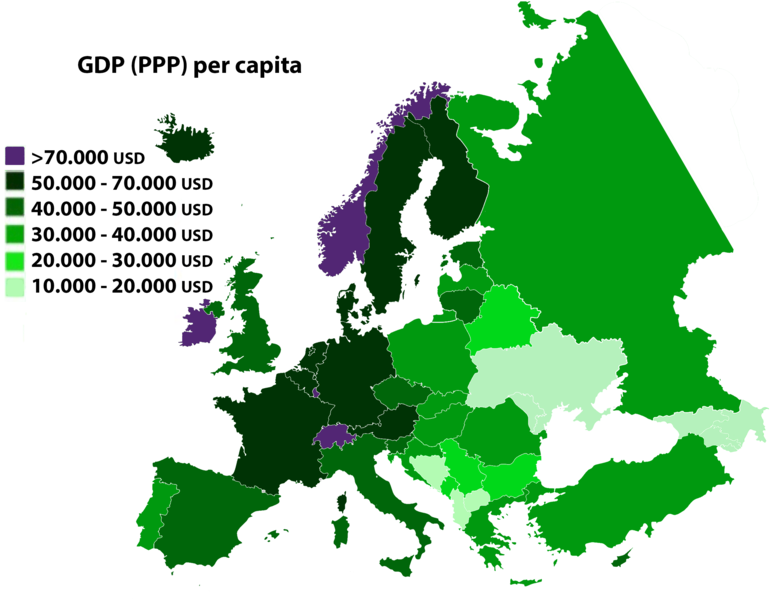
Map of European GDP per capita PPP (purchasing power parity).
Source: World Bank, 2021
File history
Click on a date/time to view the file as it appeared at that time.
| Date/Time | Thumbnail | Dimensions | User | Comment | |
|---|---|---|---|---|---|
| current | 15:57, 15 April 2023 | | 2,560 × 1,957 (568 KB) | Vater-96 | Corrected a mistake regarding Croatia coloring. |
| 09:16, 4 January 2023 |  | 2,560 × 1,957 (574 KB) | Jirka.h23 | sharper text and update. | |
| 13:32, 29 August 2022 |  | 2,560 × 1,957 (914 KB) | Рагин1987 | Extended map | |
| 10:26, 9 September 2020 |  | 451 × 422 (180 KB) | Jirka.h23 | Update by WB (2019). https://data.worldbank.org/indicator/NY.GDP.PCAP.PP.CD | |
| 06:03, 30 August 2019 |  | 451 × 422 (207 KB) | Jirka.h23 | Latvia nd Russia reached over 30 000 (2019). | |
| 15:55, 24 March 2019 |  | 451 × 422 (215 KB) | Merangs | Reverted to version as of 15:45, 24 March 2019 (UTC) | |
| 15:49, 24 March 2019 |  | 451 × 422 (90 KB) | Merangs | Reverted to version as of 13:02, 31 July 2018 (UTC) | |
| 15:45, 24 March 2019 |  | 451 × 422 (215 KB) | Merangs | Corrected one little mistake - Poland reached over $30,000 per https://www.ceicdata.com/en/indicator/poland/forecast-gdp-ppp-per-capita | |
| 13:02, 31 July 2018 |  | 451 × 422 (90 KB) | Jirka.h23 | Update by 2017 IMF data. | |
| 07:29, 1 July 2016 |  | 451 × 422 (91 KB) | Jirka.h23 | Update by IMF 2016 estimates. Changed: Slovakia, Slovenia, Romania and Bosnia. | |
| 09:58, 12 October 2015 |  | 451 × 422 (77 KB) | Jirka.h23 | Update from 2014 to 2015 data. (Source in the talk page). | |
| 13:47, 8 October 2015 |  | 451 × 422 (82 KB) | El-Kelaa-des-Sraghna | Reverted to version as of 03:56, 8 October 2015 (UTC) Source mentioned in the Talk Page | |
| 10:52, 8 October 2015 |  | 451 × 422 (77 KB) | Jirka.h23 | Please source your changes next time! Only correcting United Kingdom (above 40) Source: [https://www.imf.org/external/pubs/ft/weo/2015/01/weodata/weorept.aspx?sy=2015&ey=2015&scsm=1&ssd=1&sort=country&ds=.&br=1&pr1.x=52&pr1.y=7&c=512%2C668%2C914%2C672%... | |
| 03:56, 8 October 2015 |  | 451 × 422 (82 KB) | El-Kelaa-des-Sraghna | Reverted to version as of 05:07, 7 October 2015 (UTC) I updated it with data of the IMF. If there are differences between IMF and the World Bank, that should be discussed on the Talk Page, please! | |
| 10:22, 7 October 2015 |  | 451 × 422 (77 KB) | Jirka.h23 | Correction of figures - Ireland, Finland and France. World Bank 2014 http://data.worldbank.org/indicator/NY.GDP.PCAP.PP.CD?order=wbapi_data_value_2014+wbapi_data_value+wbapi_data_value-last&sort=asc | |
| 05:07, 7 October 2015 |  | 451 × 422 (82 KB) | El-Kelaa-des-Sraghna | Update with figures of 2014 | |
| 14:48, 17 July 2014 |  | 451 × 422 (114 KB) | Jirka.h23 | Update from the World Bank page, added Montenegro and 47,000+ http://data.worldbank.org/indicator/NY.GDP.PCAP.PP.CD?order=wbapi_data_value_2013+wbapi_data_value+wbapi_data_value-last&sort=desc | |
| 07:24, 19 June 2013 |  | 451 × 422 (128 KB) | Jirka.h23 | update 2012 by CIA | |
| 21:42, 2 January 2011 |  | 451 × 422 (15 KB) | Randam | update | |
| 09:24, 5 August 2006 |  | 454 × 422 (6 KB) | Ronline~commonswiki | ||
| 08:39, 14 April 2005 |  | 454 × 422 (9 KB) | Ronline~commonswiki | Updated to 2005 figures from IMF. | |
| 02:50, 30 January 2005 |  | 454 × 422 (9 KB) | Ronline~commonswiki | Map of European GDP per capita (PPP) {{GFDL}} Category:Maps of Europe |
File usage
The following pages on the English Wikipedia use this file (pages on other projects are not listed):
Global file usage
The following other wikis use this file:
- Usage on ar.wikipedia.org
- Usage on ba.wikipedia.org
- Usage on bs.wikipedia.org
- Usage on ca.wikipedia.org
- Usage on cs.wikipedia.org
- Usage on de.wikipedia.org
- Usage on eo.wikipedia.org
- Usage on es.wikipedia.org
- Usage on fi.wikipedia.org
- Usage on fi.wiktionary.org
- Usage on fr.wikipedia.org
- Usage on gl.wikipedia.org
- Usage on hr.wikipedia.org
- Usage on hu.wikipedia.org
- Usage on hy.wikipedia.org
- Usage on ja.wikipedia.org
- Usage on kk.wikipedia.org
- Usage on li.wikibooks.org
- Usage on mk.wikipedia.org
- Usage on nl.wikipedia.org
- Usage on ro.wikipedia.org
- Usage on sd.wikipedia.org
- Usage on sq.wikipedia.org
- Usage on sv.wikipedia.org
- Usage on tr.wikipedia.org
- Usage on uz.wikipedia.org
- Usage on vi.wikipedia.org
- Usage on zh.wikipedia.org