Water supply and sanitation in the United Kingdom
| United Kingdom: Water and Sanitation | ||
|---|---|---|

| ||
| Data | ||
| Access to an improved water source | 100% (2015)[1] | |
| Access to improved sanitation | 99% (2015)[1] | |
| Continuity of supply (%) | 100% | |
| Average urban water use (l/c/d) | 150 | |
| Average urban domestic water and sewer bill for 20m3 | n/a | |
| Share of household metering | 33% (2008) [2] | |
| Non-revenue water | 20% (2010-2011) [3] | |
| Share of collected wastewater treated | 100% | |
| Annual investment in WSS | n/a | |
| Share of self-financing by utilities | n/a | |
| Share of tax-financing | n/a | |
| Share of external financing | n/a | |
| Institutions | ||
| Decentralization to municipalities | No | |
| National water and sanitation company | None | |
| Water and sanitation regulator | Three regulators, one each for England/Wales, Scotland and Northern Ireland | |
| Responsibility for policy setting | ||
| Sector law | None | |
| Number of service providers | 28 | |
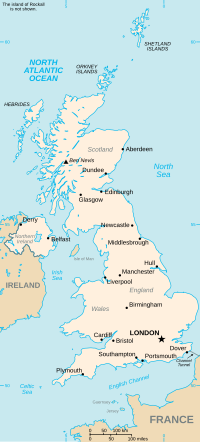
Public water supply and sanitation in the United Kingdom is characterised by universal access and generally good service quality[citation needed]. A salient feature of the sector in the United Kingdom compared to other developed countries is the diversity of institutional arrangements between the constituting parts of the UK (England and Wales; Scotland; and Northern Ireland), which are each described in separate articles, while this article is devoted to some common issues across the United Kingdom.
Access
Access to improved water supply and sanitation in the UK is universal. In 2015, 100% of the population had access to improved water supply and 99% of the population had access to "improved" sanitation.[4][1]
| Urban (90% of the population) | Rural (10% of the population) | Total | ||
|---|---|---|---|---|
| Water | Broad definition | 100% | 100% | 100% |
| House connections | 100% | 98% | 100% | |
| Sanitation | Sewerage | 97% | 97% | 97% |
Source: WHO/UNICEF Joint Monitoring Program (2008) [5]
Water sources
According to the Environment Agency, total water abstraction for public water supply in the UK was 16,406 megalitres per day in 2007.[6] Groundwater contributes 30 per cent of public supply water in England. In Wales and Scotland groundwater provides about five per cent of public supply.[7] The majority of the UK's abstraction of surface water is from reservoirs, where rainwater is transported via rivers and streams and contained in an artificial or natural lake until it is required. [8]
Responsibility for water supply and sanitation
Policy and regulation
In England and Wales the economic regulator of water companies is the Water Services Regulation Authority (Ofwat). The Environment Agency is responsible for environmental regulation, and the Drinking Water Inspectorate for regulating drinking water quality. The economic water industry regulator in Scotland is the Water Industry Commission for Scotland and the environmental regulator is the Scottish Environment Protection Agency. Drinking water standards and wastewater discharge standards in the UK, as in other countries of the European Union, were determined by the EU (see Water supply and sanitation in the European Union) before Brexit.
Service provision
In England and Wales water and sewerage services are provided by 10 private regional water and sewerage companies and 13 mostly smaller private "water only" companies. In Scotland water and sewerage services are provided by a single public company, Scottish Water. In Northern Ireland water and sewerage services are also provided by a single public entity, Northern Ireland Water.

Employment
Total employment by UK water companies amounted to 41,000 full-time equivalent jobs in 2012/13, according to an analysis by the consulting firm Deloitte. In addition, 86,000 jobs were supported indirectly.[9]
Financial aspects
Tariffs
According to a 2006 survey by NUS consulting the average water tariff (price) without sewerage in the U.K. for large consumers was the equivalent of US$1.90 per cubic metre. This was the third-highest tariff among the 14 mostly OECD countries covered by the report.[10]
Metering
A particularity of water tariffs in the U.K. is the low share of metering. Most users are not billed on a volumetric basis and have no financial incentive for water conservation. Since the 1990s efforts have been made to increase the share of household metering, which reached 33% in 2008.[2] The Environment Agency would like to see 75% of households metered by 2025. The Fairness on Tap coalition (including National Trust, Waterwise, WWF and RSPB) is calling for the government to set out a strategy to install water meters in at least 80% of England where there is the greatest pressure on the freshwater environment and people's pockets, by 2020. Studies show that water meters lead to a 5-15% reduction in household water use.[11]
See also
- EU water policy
- Water Framework Directive
- Water supply and sanitation in England and Wales
- Water supply and sanitation in Gibraltar
- Water supply and sanitation in Scotland
- Water supply and sanitation in Northern Ireland
References
- ^ a b c WHO/UNICEF (2015) Progress on sanitation and drinking water - 2015 update and MDG assessment, Joint Monitoring Programme for Water Supply and Sanitation
- ^ a b Water UK
- ^ BBC:How much does your water company leak?, 5 April 2012, retrieved on July 24, 2012
- ^ "WASHwatch.org - United Kingdom". washwatch.org. Retrieved 2017-03-22.
- ^ WHO/UNICEF JMP
- ^ Environment Agency
- ^ "Groundwater Resources in the UK".
- ^ "Water UK".
- ^ "Tapping into growth: economic impact report". Water UK. June 2014. Retrieved 1 September 2014.
- ^ NUS Consulting
- ^ Environment Agency
External links
- Water UK
- Environment Agency 's water quality website
- Water Resources Management in Cooperation with Agriculture project

