
File:Chernboyl vs Fukuashima2.png
Size of this preview: 800 × 491 pixels. Other resolutions: 320 × 197 pixels | 640 × 393 pixels.
Original file (977 × 600 pixels, file size: 28 KB, MIME type: image/png)
| This is a file from the Wikimedia Commons. Information from its description page there is shown below. Commons is a freely licensed media file repository. You can help. |
Summary
| Description |
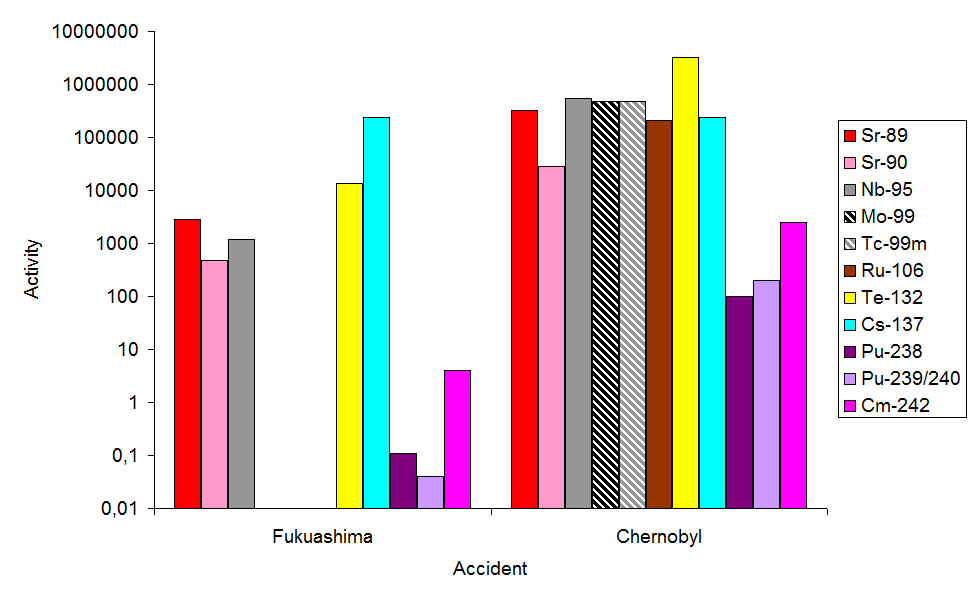
English: A bar graph of the levels of different radioisotopes in soil 500 meters from the damaged reactors at Fukuashima compared with the release at Chernboyl (OECD report). I used the data from TEPCO which they ontained from the Japan Chemical Anaylsis Centre, the original samples from Japan were soil from the playground |
| Date | |
| Source | I created the bar chart using TEPCO data and |
| Author | Mark Foreman |
Licensing
I, the copyright holder of this work, hereby publish it under the following licenses:

|
Permission is granted to copy, distribute and/or modify this document under the terms of the GNU Free Documentation License, Version 1.2 or any later version published by the Free Software Foundation; with no Invariant Sections, no Front-Cover Texts, and no Back-Cover Texts. A copy of the license is included in the section entitled GNU Free Documentation License. |
This file is licensed under the Creative Commons Attribution-Share Alike 3.0 Unported license.
- You are free:
- to share – to copy, distribute and transmit the work
- to remix – to adapt the work
- Under the following conditions:
- attribution – You must give appropriate credit, provide a link to the license, and indicate if changes were made. You may do so in any reasonable manner, but not in any way that suggests the licensor endorses you or your use.
- share alike – If you remix, transform, or build upon the material, you must distribute your contributions under the same or compatible license as the original.
You may select the license of your choice.
File history
Click on a date/time to view the file as it appeared at that time.
| Date/Time | Thumbnail | Dimensions | User | Comment | |
|---|---|---|---|---|---|
| current | 07:10, 19 July 2011 | | 977 × 600 (28 KB) | MarkForeman | {{Information |Description ={{en|1=A bar graph of the levels of different radioisotopes in soil 500 meters from the damaged reactors at Fukuashima compared with the release at Chernboyl (OECD report). I used the data from TEPCO which they ontained from |
File usage
No pages on the English Wikipedia use this file (pages on other projects are not listed).
Global file usage
The following other wikis use this file:
- Usage on fr.wikipedia.org
- Usage on pt.wikipedia.org