
File:Continuous Fourier transform of rect and sinc functions.gif
Continuous_Fourier_transform_of_rect_and_sinc_functions.gif (500 × 375 pixels, file size: 657 KB, MIME type: image/gif, looped, 173 frames, 45 s)
| This is a file from the Wikimedia Commons. Information from its description page there is shown below. Commons is a freely licensed media file repository. You can help. |
| Description |
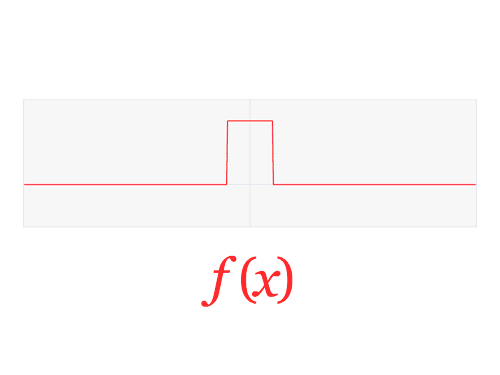
English: Fourier transform of the rect function and sinc functions.
The continuous Fourier transform takes an input function f(x) in the time domain and turns it into a new function, ƒ̂(x) in the frequency domain. In the first part of the animation, the Fourier transform (as usually defined in signal processing) is applied to the rectangular function, returning the normalized sinc function. In the second part, the transform is reapplied to the normalized sinc function, and we get our original rect function back. It takes four iterations of the Fourier transform to get back to the original function. However, in this particular example, and with this particular definition of the Fourier transform, the rect function and the sinc function are exact inverses of each other. Using other definitions would require four applications, as we would get a distorted rect and sinc function in the intermediate steps. For simplicity, I opted for this so I don't have very tall and very wide intermediate functions, or the need for a very long animation. It doesn't really work visually, and the details can be easily extrapolated once the main idea gets across. In this example, it also happens that there are no imaginary/sine components, so only the real/cosine components are displayed. Shown at left, overlaid on the red time domain curve, there's a changing yellow curve. This is the approximation using the components extracted from the frequency domain "found" so far (the blue cosines sweeping the surface). The approximation is calculated by adding all the components, integrating along the entire surface, with the appropriate amplitude correction due to the specific Fourier transform and ranges used. |
||
| Date | |||
| Source | Own work | ||
| Author | Lucas Vieira | ||
| Permission (Reusing this file) |
|
||
| Other versions |
HD video, and a variant with square wave with discrete frequencies |
File history
Click on a date/time to view the file as it appeared at that time.
| Date/Time | Thumbnail | Dimensions | User | Comment | |
|---|---|---|---|---|---|
| current | 22:45, 3 March 2013 | | 500 × 375 (657 KB) | LucasVB | {{Information |Description={{en|1=Fourier transform of the rect function and sinc functions. The continuous Fourier transform takes an input function f(x) in the time domain and tu... |