
File:Dutycycle.png
Size of this preview: 800 × 280 pixels. Other resolutions: 320 × 112 pixels | 640 × 224 pixels | 1,500 × 525 pixels.
Original file (1,500 × 525 pixels, file size: 12 KB, MIME type: image/png)
| This is a file from the Wikimedia Commons. Information from its description page there is shown below. Commons is a freely licensed media file repository. You can help. |
Summary

|
File:Dutycycle.svg is a vector version of this file. It should be used in place of this PNG file when not inferior.
File:Dutycycle.png → File:Dutycycle.svg
For more information, see Help:SVG. |
 |
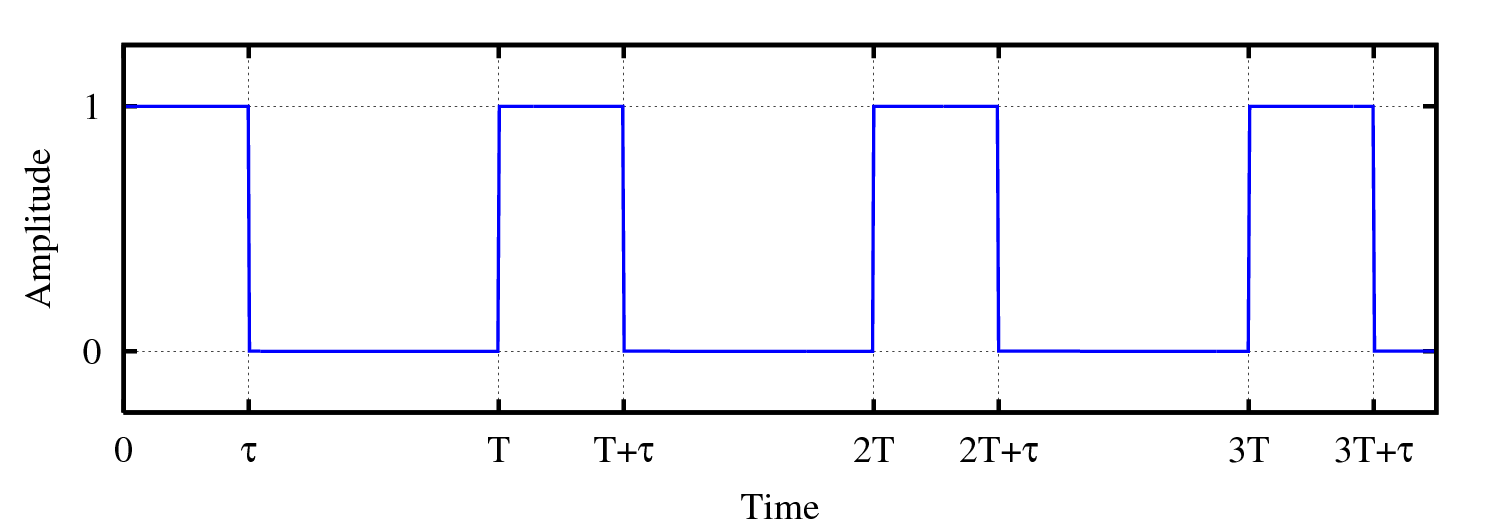
This figure represents a rectangular waveform used to define the concept of dutycycle. It has been generated using the following gnuplot code (executed by gnuplot 4.0):
This plot was created with Gnuplot by n.
And the eps file has been converted into png using the following command (linux)
convert -density 300 dutycycle.eps dutycycle.png
Licensing
I, the copyright holder of this work, hereby publish it under the following licenses:

|
Permission is granted to copy, distribute and/or modify this document under the terms of the GNU Free Documentation License, Version 1.2 or any later version published by the Free Software Foundation; with no Invariant Sections, no Front-Cover Texts, and no Back-Cover Texts. A copy of the license is included in the section entitled GNU Free Documentation License. |
| This file is licensed under the Creative Commons Attribution-Share Alike 3.0 Unported license. | ||
| ||
| This licensing tag was added to this file as part of the GFDL licensing update. |
This file is licensed under the Creative Commons Attribution-Share Alike 2.5 Generic, 2.0 Generic and 1.0 Generic license.
- You are free:
- to share – to copy, distribute and transmit the work
- to remix – to adapt the work
- Under the following conditions:
- attribution – You must give appropriate credit, provide a link to the license, and indicate if changes were made. You may do so in any reasonable manner, but not in any way that suggests the licensor endorses you or your use.
- share alike – If you remix, transform, or build upon the material, you must distribute your contributions under the same or compatible license as the original.
You may select the license of your choice.
File history
Click on a date/time to view the file as it appeared at that time.
| Date/Time | Thumbnail | Dimensions | User | Comment | |
|---|---|---|---|---|---|
| current | 19:38, 23 June 2006 | 1,500 × 525 (12 KB) | CyrilB~commonswiki | {{Information |Description=Update of the previous picture, where the labels D.T are replaced by the greek letter tau |Source=own work |Date=23/06/06 |Author=Cyril BUTTAY |Permission=as licensed |other_versions= }} | |
| 22:27, 22 March 2006 | 1,500 × 525 (13 KB) | CyrilB~commonswiki | Cyril BUTTAY This figure represents a rectangular waveform used to define the concept of dutycycle. It has been generated using the following gnuplot code (executed by gnuplot 4.0): <pre> # This file is used to generate a plot that defines the # concep |
File usage
No pages on the English Wikipedia use this file (pages on other projects are not listed).
Global file usage
The following other wikis use this file:
- Usage on cs.wikipedia.org
- Usage on da.wikipedia.org
- Usage on it.wikipedia.org
- Usage on ja.wikipedia.org
- Usage on no.wikipedia.org
- Usage on sk.wikipedia.org
- Usage on zh.wikipedia.org