File:Lamb–Oseen vortex animation.gif
Lamb–Oseen_vortex_animation.gif (400 × 400 pixels, file size: 3.46 MB, MIME type: image/gif, looped, 250 frames, 27 s)
| This is a file from the Wikimedia Commons. Information from its description page there is shown below. Commons is a freely licensed media file repository. You can help. |
Summary
| DescriptionLamb–Oseen vortex animation.gif |
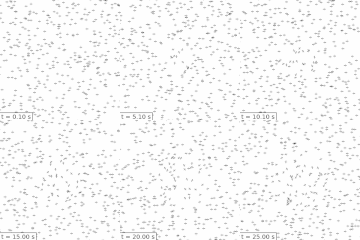
English: Animation of the Lamb–Oseen vortex equation in air, aging up to 25 seconds.
Viewed window size is 20 cm in width (out of an infinite air space). Floating particles show the movement of the fluid as well as local vorticity; the growing boundary between the rotational vortex core and the irrotational exterior can be clearly seen. Viscosity = 1.5e-5 m^2/s (air under standard conditions), Circulation = 1e-2 m^2/s. See also File:Rankine_vortex_animation.gif for the same done with a Rankine vortex. |
| Date | |
| Source | Own work |
| Author | Nanite |
Source
Python source code. Requires matplotlib ImageMagick. Possibly does not run in Windows.
#!/usr/bin/env python3

import numpy as np
from scipy.special import expi
from matplotlib import pyplot as plt
from matplotlib import collections

twopi = 2*np.pi

# kinematic viscosity m^2/s
viscosity = 1.5e-5

# fixed circulation of the lamb-onseen vortex, m^2/s
circulation = 10e-3

# radial range in which to place particles, m
rmax = 0.2
rmark = 0.003 # radius of 'marker'
# number of particles
N = 600

# radial coordinate of particles, this does not change over time
# place them with sqrt of uniform 1D-distributed so they are uniform in 2D
part_r = rmax * np.sqrt(np.linspace(0, 1, N+1)[1:])
# precalculate some things
invr2 = 1/part_r**2
neg_tprime = -part_r**2 / (4 * viscosity) # negative of transition time for this radius
# angular coordinate of particles, set them randomly.
part_th = twopi*np.random.rand(N)
# rotation of particles - start them all out as horizontal
part_rot = np.zeros((N,))

dt = 0.01
i = 0

frames = []
frametimes = []
nextframetime = 0

fig = plt.figure()
fig.set_size_inches(4,4)
ax = plt.axes((0,0,1,1))
ax.set_xlim(-0.7*rmax, +0.7*rmax)
ax.set_ylim(-0.7*rmax, +0.7*rmax)
ax.set_aspect('equal')
ax.set_axis_off()

linesegs = np.empty((2*N, 2, 2))

while True:
    i += 1
    t = i*dt
    if t > 25:
        break

    # use finite difference to increment angular coordinate and rotation of particles.
    # we oould calculate these in closed form in terms of Ei(x) function, but this
    # is easy and good enough.
    part_th += (-dt * circulation / twopi) * np.expm1(neg_tprime/t) * invr2
    # note the rotation of particle is half of the vorticity.
    part_rot += (dt * circulation / (4*twopi*viscosity * t)) * np.exp(neg_tprime/t)

    # only show every tenth frame
    if i % 10 == 0:
        frame = f"frames/frame{i}.png"
        frames.append(frame)
        frametimes.append(t)

        [c.remove() for c in ax.lines]
        [c.remove() for c in ax.collections]
        [c.remove() for c in ax.texts]
        x = part_r*np.cos(part_th)
        y = part_r*np.sin(part_th)
        cr = rmark*np.cos(part_rot)
        sr = rmark*np.sin(part_rot)
        # first line segments of the crosses
        linesegs[0::2, 0, 0] = x + cr
        linesegs[0::2, 0, 1] = y + sr
        linesegs[0::2, 1, 0] = x - cr
        linesegs[0::2, 1, 1] = y - sr
        # second line segments of the crosses - perpendicular
        # note that having them distinct length or shade makes it visually MUCH easier to see
        # distinction between the rotational core and irrotational exterior, due to distinct texture.
        linesegs[1::2, 0, 0] = x - sr
        linesegs[1::2, 0, 1] = y + cr
        linesegs[1::2, 1, 0] = x + sr
        linesegs[1::2, 1, 1] = y - cr
        linecoll = collections.LineCollection(linesegs, linewidths=1, colors=((0., 0., 0.), (0.75, 0.75, 0.75)),
                               linestyle='solid')
        ax.add_collection(linecoll)

        [c.remove() for c in fig.texts]
        fig.text(0.01,0.01,f't = {t:.02f} s', fontsize='x-large', bbox=dict(facecolor='w', alpha=1))
        fig.savefig(frame)

# gif frame times are in centiseconds
delays = list(np.diff(np.round(np.array(frametimes) * 100)))
# show the last frame for a bit extra time
delays.append(delays[-1] + 200)

print(len(frames), len(delays))
assert(len(delays) == len(frames))

### Assemble animation using ImageMagick ###
calllist = 'convert'.split()
for delay,frame in zip(delays,frames):
    calllist += ['-delay',str(int(delay))]
    calllist += [frame]
calllist += '-loop 0 -layers Optimize _animation.gif'.split()
f = open('anim_command.txt','w')
f.write(' '.join(calllist)+'\n')
f.close()

print("composing into animated gif...", end='')
import sys, subprocess, os
sys.stdout.flush()
subprocess.call(calllist)
print("      done")
os.rename('_animation.gif','animation.gif')
Licensing
| This file is made available under the Creative Commons CC0 1.0 Universal Public Domain Dedication. | |
| The person who associated a work with this deed has dedicated the work to the public domain by waiving all of their rights to the work worldwide under copyright law, including all related and neighboring rights, to the extent allowed by law. You can copy, modify, distribute and perform the work, even for commercial purposes, all without asking permission.
http://creativecommons.org/publicdomain/zero/1.0/deed.enCC0Creative Commons Zero, Public Domain Dedicationfalsefalse |
Captions
Items portrayed in this file
depicts
8 June 2020
File history
Click on a date/time to view the file as it appeared at that time.
| Date/Time | Thumbnail | Dimensions | User | Comment | |
|---|---|---|---|---|---|
| current | 13:43, 8 June 2020 |  | 400 × 400 (3.46 MB) | Nanite | Uploaded own work with UploadWizard |
File usage
The following 2 pages use this file:
Global file usage
The following other wikis use this file:
- Usage on es.wikipedia.org

