
File:Verlauf Kohlendioxidgehalt.png
Size of this preview: 800 × 582 pixels. Other resolutions: 320 × 233 pixels | 640 × 466 pixels | 1,024 × 745 pixels | 1,280 × 931 pixels | 1,732 × 1,260 pixels.
Original file (1,732 × 1,260 pixels, file size: 261 KB, MIME type: image/png)
| This is a file from the Wikimedia Commons. Information from its description page there is shown below. Commons is a freely licensed media file repository. You can help. |
Summary

|
This graph image could be re-created using vector graphics as an SVG file. This has several advantages; see Commons:Media for cleanup for more information. If an SVG form of this image is available, please upload it and afterwards replace this template with
{{vector version available|new image name}}.
It is recommended to name the SVG file “Verlauf Kohlendioxidgehalt.svg”—then the template Vector version available (or Vva) does not need the new image name parameter. |
| Description |
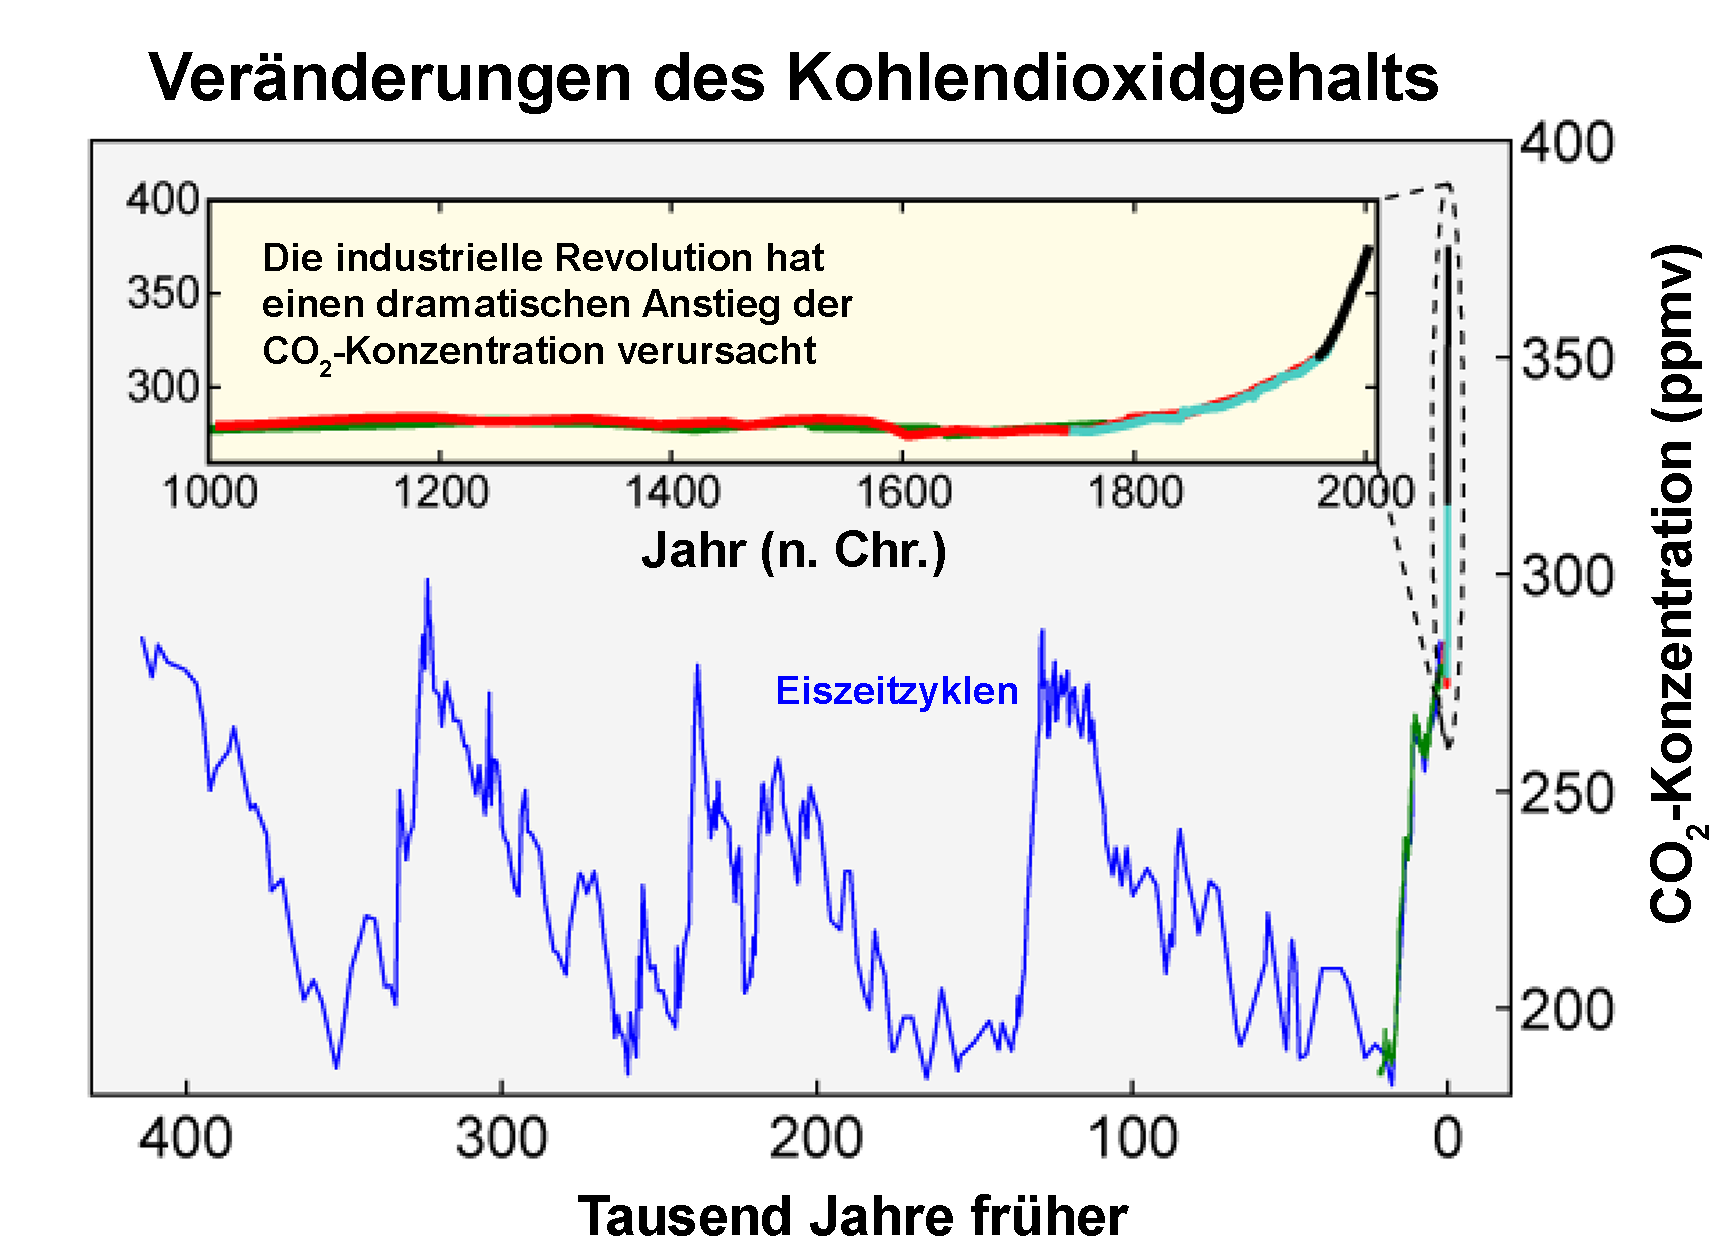
Deutsch: Das Bild zeigt den Verlauf der CO2-Konzentration in der Atmosphäre während der letzten 400.000 Jahre. Näheres bitte Originalbild entnehmen. Erläuterung
|
| Date | |
| Source |
Transferred from de.wikipedia to Commons by Leyo using CommonsHelper. |
| Author |
Das Bild wurde für "Global Warming Art" erstellt ([1]), Übersetzung: David W. |
| Other versions | Derivative works of this file: Verlauf Kohlendioxidgehalt-2012-08-05.png |
Licensing
Fotowerkstatt
This picture was reworked by the Fotowerkstatt. You can propose images to improve as well.

|
Permission is granted to copy, distribute and/or modify this document under the terms of the GNU Free Documentation License, Version 1.2 or any later version published by the Free Software Foundation; with no Invariant Sections, no Front-Cover Texts, and no Back-Cover Texts. A copy of the license is included in the section entitled GNU Free Documentation License. |
| This file is licensed under the Creative Commons Attribution-Share Alike 3.0 Unported license. | ||
| ||
| This licensing tag was added to this file as part of the GFDL licensing update. |
Original upload log
The original description page was here. All following user names refer to de.wikipedia.
- 2006-10-08 14:06 David W. 1732×1260× (267335 bytes) {{Information |Beschreibung=Das Bild zeigt den Verlauf der CO2-Konzentration in der Atmosphäre während der letzten 400.000 Jahre. Näheres bitte Originalbild entnehmen. |Quelle= |Urheber=Übersetzung: ~~~ |Datum=Oktober 2006 |Genehmigung= |Andere Versio
File history
Click on a date/time to view the file as it appeared at that time.
| Date/Time | Thumbnail | Dimensions | User | Comment | |
|---|---|---|---|---|---|
| current | 15:43, 6 January 2010 | | 1,732 × 1,260 (261 KB) | File Upload Bot (Magnus Manske) | {{BotMoveToCommons|de.wikipedia|year={{subst:CURRENTYEAR}}|month={{subst:CURRENTMONTHNAME}}|day={{subst:CURRENTDAY}}}} {{Information |Description={{de|Das Bild zeigt den Verlauf der CO2-Konzentration in der Atmosphäre während der letzten 400.000 Jahre. |
File usage
No pages on the English Wikipedia use this file (pages on other projects are not listed).
Global file usage
The following other wikis use this file:
- Usage on de.wikipedia.org
- Usage on no.wikipedia.org