Jump to content

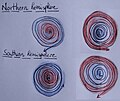
File:Windmovement on weathermaps.JPG

Page contents not supported in other languages.
This is a file from the Wikimedia Commons
From Wikipedia, the free encyclopedia

Original file (2,208 × 1,852 pixels, file size: 303 KB, MIME type: image/jpeg)

Summary

Description
English: A incorrect? schematic of a low and high pressure zone on an isobar weather map. The schematic indicates the wind movement and temperature change within the zone; and this for the Northern hemisphere and the Southern hemisphere. The reversed direction is due to the Coriolis effect. A possible flaw in the image could be the coloring; Cold/dry air is more dense and moves towards the hotter/more moist environment, where this could be colored the other way around. Ask Thegreatdr at wikipedia. The arrows are in any case OK however, only the coloring might be flawed. If incorrect, make a new version of my image (with proper coloring). The schematic was based on a drawing in the book "Sailing for dummies" by JJ Isler, Peter Isler
Date
Source Own work
Author KVDP

Licensing

Public domain I, the copyright holder of this work, release this work into the public domain. This applies worldwide.
In some countries this may not be legally possible; if so:
I grant anyone the right to use this work for any purpose, without any conditions, unless such conditions are required by law.

Captions

Add a one-line explanation of what this file represents

Items portrayed in this file

depicts

28 July 2009

File history

Click on a date/time to view the file as it appeared at that time.

Date/TimeThumbnailDimensionsUserComment
current06:28, 28 July 2009Thumbnail for version as of 06:28, 28 July 20092,208 × 1,852 (303 KB)Genetics4good{{Information |Description={{en|1=A schematic of a low and high pressure zone on an isobar weather map. The schematic indicates the wind movement and temperature change within the zone; and this for the Northern hemisphere and the Southern hemisphere. The

Metadata