Gauss iterated map: Difference between revisions
Appearance
Content deleted Content added
m →Properties: wikilink bifurcation diagram |
No edit summary |
||
| Line 15: | Line 15: | ||
{| |
{| |
||
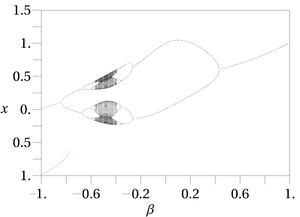
|[[Image:Gauss Orbit Map alpha=4.9.png|thumb|300px|Bifurcation diagram of the Gauss map with <math>\alpha=4.90</math> and <math>\beta</math> in the range −1 to +1. This graph resembles a mouse.]] |
|[[Image:Gauss Orbit Map alpha=4.9.png|thumb|300px|Bifurcation diagram of the Gauss map with <math>\alpha=4.90</math> and <math>\beta</math> in the range −1 to +1. This graph resembles a mouse.]] |
||
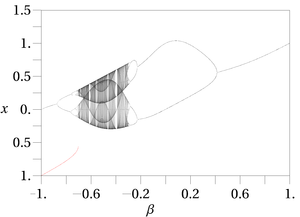
|[[Image:Gauss Orbit Map alpha=6.2.png|thumb|300px|Bifurcation diagram of the Gauss map with <math>\alpha=6.20</math> and <math>\beta</math> in the range −1 to +1.]] |
|[[Image:Gauss Orbit Map alpha=6.2.png|thumb|300px|Bifurcation diagram of the Gauss map with <math>\alpha=6.20</math> and <math>\beta</math> in the range −1 to +1. This graph resembles a mouse with slightly bigger ears.]] |
||
|} |
|} |
||
Revision as of 16:16, 31 January 2014

In mathematics, the Gauss map (also known as Gaussian map[1] or mouse map), is a nonlinear iterated map of the reals into a real interval given by the Gaussian function:
where α and β are real parameters.
Named after Johann Carl Friedrich Gauss, the function maps the bell shaped Gaussian function similar to the logistic map.
Properties
In the parameter real space can be chaotic. The map is also called the mouse map because its bifurcation diagram resembles a mouse (see Figures).
References
- ^ Chaos and nonlinear dynamics: an introduction for scientists and engineers, by Robert C. Hilborn, 2nd Ed., Oxford, Univ. Press, New York, 2004.


