
File:Money-supply.png

Original file (1,261 × 718 pixels, file size: 66 KB, MIME type: image/png)
| A vector version of this image is also available, and should be used in place of this raster image where the raster image contains information that could be stored more efficiently and/or accurately in the SVG format, as a vector graphic.
If its license requires the preservation of attribution or revision history, the raster version of this image should not be deleted, in order to maintain this information. For more information, see the documentation on MediaWiki's support of SVG images. |  |
Summary[edit]
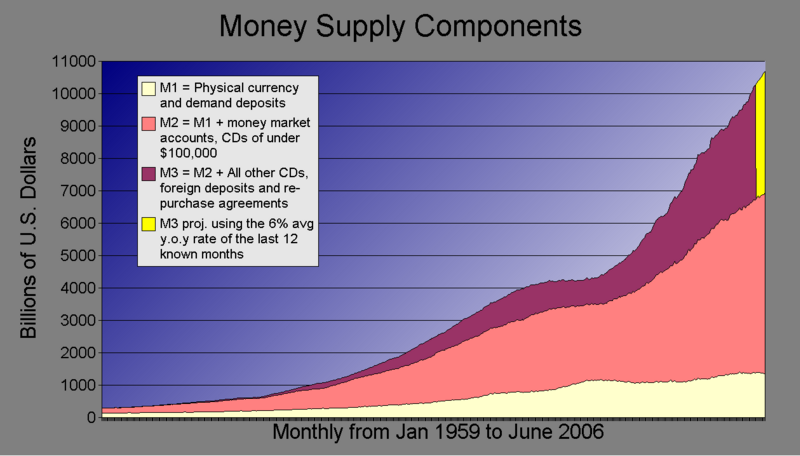
Original image by User:Carbonate, modified to fill legend in white. See Carbonate's comments below. Cintrom 21:49, 27 October 2006 (UTC)
I created this graph from the federal reserves H.6 data located in the URLs http://www.federalreserve.gov/releases/h6/hist/h6hist1.txt and http://www.federalreserve.gov/releases/h6/hist/h6hista.txt. Although the federal reserve is a private institution, the data supplied describes the physical world (ie. the amount of dollar that exist in the world) and is thus ineligible for copyright protection. The graph was created with openoffice.
I have also added a 4th data line that projects M3 based on the average of the year over year rate of increase over the last twelve known months. This came to about 6.2%. This graph is now current as of the data released on 20/07/06.
Licensing[edit]
| I, the copyright holder of this work, hereby release it into the public domain. This applies worldwide. If this is not legally possible: |
File history
Click on a date/time to view the file as it appeared at that time.
| Date/Time | Thumbnail | Dimensions | User | Comment | |
|---|---|---|---|---|---|
| current | 02:57, 12 December 2006 | | 1,261 × 718 (66 KB) | Carbonate (talk | contribs) | This is now updated to Oct of 2006 and includes a lighter background in the legend as requested (tho it isn't bright white like the interim modification). The lable on the X axis is wrong and will be corrected on the next version. The legend states that |
| 21:48, 27 October 2006 |  | 1,255 × 819 (37 KB) | Cintrom (talk | contribs) | Original image by User:Carbonate, modified to fill legend in white. See Carbonate's comments below. ~~~~ I created this graph from the federal reserves H.6 data located in the URLs http://www.federalreserve.gov/releases/h6/hist/h6hist1.txt and http | |
| 01:53, 21 July 2006 |  | 1,255 × 819 (58 KB) | Carbonate (talk | contribs) | Same as the last graph except that I have updated it with data released on 20/07/06. I have also added a 4th data line that starts where the M3 reporting ends and uses the average of the year over year increases for the last 12 known months. This came o | |
| 06:16, 13 July 2006 |  | 1,058 × 819 (46 KB) | Carbonate (talk | contribs) | I created this graph from the federal reserves H.6 data located in the URLs http://www.federalreserve.gov/releases/h6/hist/h6hist1.txt and http://www.federalreserve.gov/releases/h6/hist/h6hista.txt. Although the federal reserve is a private institution, |
You cannot overwrite this file.