
Liebenwalde
Liebenwalde | |
|---|---|
 Kreuzbruch church | |
 Coat of arms | |
Location of Liebenwalde within Oberhavel district  | |
 Liebenwalde  Liebenwalde | |
| Coordinates: 52°52′N 13°24′E / 52.867°N 13.400°E | |
| Country | Germany |
| State | Brandenburg |
| District | Oberhavel |
| Subdivisions | 6 districts |
| Government | |
| • Mayor | Jörn Lehmann |
| Area | |
| • Total | 138.84 km2 (53.61 sq mi) |
| Elevation | 41 m (135 ft) |
| Population (2022-12-31)[1] | |
| • Total | 4,481 |
| • Density | 32/km2 (84/sq mi) |
| Time zone | UTC+01:00 (CET) |
| • Summer (DST) | UTC+02:00 (CEST) |
| Postal codes | 16559 |
| Dialling codes | 033054 |
| Vehicle registration | OHV |
| Website | www.liebenwalde.de |
Liebenwalde is a town in the Oberhavel district, in Brandenburg, Germany. It is situated 16 km northeast of Oranienburg, and 39 km north of Berlin (centre).
In 2003, the administrative boundaries were expanded to include Freienhagen, Hammer, Kreuzbruch, Liebenthal and Neuholland.
Demography
-
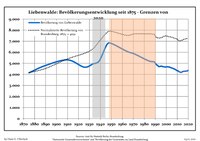 Development of Population since 1875 within the Current Boundaries (Blue Line: Population; Dotted Line: Comparison to Population Development of Brandenburg state; Grey Background: Time of Nazi rule; Red Background: Time of Communist rule)
 -
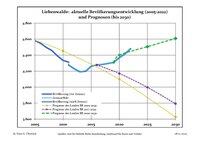 Recent Population Development (Blue Line) and Forecasts


|
|
|
References
- ^ "Bevölkerungsentwicklung und Bevölkerungsstandim Land Brandenburg Dezember 2022" (PDF). Amt für Statistik Berlin-Brandenburg (in German). June 2023.
- ^ Detailed data sources are to be found in the Wikimedia Commons.Population Projection Brandenburg at Wikimedia Commons

Towns and municipalities in Oberhavel | ||
|---|---|---|
 | ||
| International | |
|---|---|
| National | |
This Brandenburg location article is a stub. You can help Wikipedia by expanding it. |