Poles in Latvia
Appearance
| Languages | |
|---|---|
| Polish, Latvian | |
| Religion | |
| Protestant, Roman Catholicism | |
| Related ethnic groups | |
| Poles, Latvians, Lithuanians |
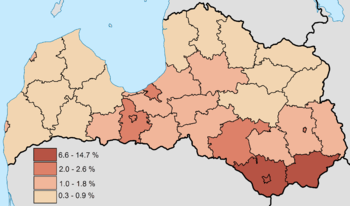
The Polish minority in Latvia numbers about 51,548 and (according to the Latvian data from 2011) forms 2.3% of the population of Latvia. Poles are concentrated in the former Inflanty Voivodeship region, with about 18,000 in Daugavpils (Dyneburg) and 17,000 in Riga. People of Polish ethnicity have lived on the territory of modern Latvia since the 16th century.
Demography
| Population with Polish ethnic affiliations [1][2] | |||||||||||||
|---|---|---|---|---|---|---|---|---|---|---|---|---|---|
| Census year | 1897 | 1920 | 1930 | 1935 | 1959 | 1970 | 1979 | 1989 | 1996 est. |
2000 | 2005 est. |
2008 est. |
2011 est. |
| Population | 65,056 | 52,244 | 59,400 | 48,637 | 59,800 | 63,000 | 62,700 | 60,416 | 63,400 | 59,505 | 56,511 | 54,024 | 51,548 |
| Percentage | 3.4% | 3.3% | 3.1% | 2.6% | 2.9% | 2.7% | 2.5% | 2.3% | 2.6% | 2.5% | 2.5% | 2.4% | 2.3% |


| Ethnic Poles distribution in Latvia [3] | ||||||||
|---|---|---|---|---|---|---|---|---|
| Census year | 1989 census |
2000 census |
2005 est. |
2008 est. | ||||
| population | % | population | % | population | % | population | % | |
| Aizkraukle District | 590 | 1.3 | 608 | 1.4 | 572 | 1.4 | 537 | 1.3 |
| Alūksne District | 99 | 0.3 | 84 | 0.3 | 73 | 0.3 | 71 | 0.3 |
| Balvi District | 102 | 0.3 | 101 | 0.3 | 85 | 0.3 | 87 | 0.3 |
| Bauska District | 840 | 1.5 | 827 | 1.6 | 774 | 1.5 | 740 | 1.5 |
| Cēsis District | 704 | 1.1 | 640 | 1.0 | 594 | 1.0 | 575 | 1.0 |
| Daugavpils District | 5,294 | 11.2 | 5,068 | 11.9 | 4,912 | 12.1 | 4,609 | 11.9 |
| Daugavpils city | 16,338 | 13.1 | 17,209 | 14.9 | 16,395 | 14.9 | 15,606 | 14.7 |
| Dobele District | 759 | 1.7 | 649 | 1.6 | 579 | 1.5 | 545 | 1.4 |
| Gulbene District | 222 | 0.7 | 227 | 0.8 | 208 | 0.8 | 194 | 0.7 |
| Jēkabpils District | 1,309 | 2.1 | 1,368 | 2.4 | 1,269 | 2.4 | 1,203 | 2.3 |
| Jelgava District | 926 | 2.4 | 856 | 2.3 | 845 | 2.3 | 810 | 2.2 |
| Jelgava city | 1,274 | 1.7 | 1,312 | 2.1 | 1,336 | 2.0 | 1,307 | 2.0 |
| Jūrmala city | 905 | 1.5 | 932 | 1.7 | 937 | 1.7 | 926 | 1.7 |
| Krāslava District | 2,499 | 6.0 | 2,441 | 6.6 | 2,286 | 6.6 | 2,169 | 6.6 |
| Kuldīga District | 252 | 0.6 | 205 | 0.5 | 185 | 0.5 | 180 | 0.5 |
| Liepāja District | 276 | 0.5 | 197 | 0.4 | 188 | 0.4 | 183 | 0.4 |
| Liepāja city | 1,298 | 1.1 | 1,120 | 1.3 | 1,054 | 1.2 | 1,001 | 1.2 |
| Limbaži District | 325 | 0.8 | 343 | 0.9 | 304 | 0.8 | 277 | 0.7 |
| Ludza District | 362 | 0.9 | 376 | 1.1 | 350 | 1.1 | 316 | 1.0 |
| Madona District | 442 | 0.9 | 388 | 0.8 | 338 | 0.8 | 311 | 0.7 |
| Ogre District | 975 | 1.5 | 894 | 1.4 | 858 | 1.4 | 837 | 1.3 |
| Preiļi District | 888 | 1.9 | 791 | 1.9 | 704 | 1.8 | 664 | 1.8 |
| Rēzekne District | 597 | 1.4 | 533 | 1.2 | 522 | 1.3 | 499 | 1.3 |
| Rēzekne city | 1,166 | 2.7 | 1,056 | 2.7 | 1,002 | 2.7 | 928 | 2.6 |
| Riga District | 2,533 | 1.7 | 2,685 | 1.9 | 2,637 | 1.7 | 2,734 | 1.6 |
| Riga city | 16,653 | 1.8 | 15,980 | 2.1 | 15,094 | 2.1 | 14,456 | 2.0 |
| Saldus District | 296 | 0.7 | 240 | 0.6 | 202 | 0.5 | 194 | 0.5 |
| Talsi District | 364 | 0.7 | 329 | 0.7 | 306 | 0.6 | 286 | 0.6 |
| Tukums District | 601 | 1.0 | 555 | 1.0 | 518 | 0.9 | 484 | 0.9 |
| Valka District | 328 | 0.9 | 295 | 0.9 | 251 | 0.8 | 228 | 0.7 |
| Valmiera District | 586 | 0.9 | 594 | 1.0 | 533 | 0.9 | 507 | 0.9 |
| Ventspils District | 97 | 0.6 | 77 | 0.5 | 73 | 0.5 | 68 | 0.5 |
| Ventspils city | 516 | 1.0 | 525 | 1.2 | 527 | 1.2 | 492 | 1.1 |
Mixed marriages are common for the ethnic Poles in Latvia: per cent distribution of males with spouse of different ethnicity was 89%, of females with spouse of different ethnicity was 90% (1990-2007)[4]
Polish organizations in Latvia
The largest Polish organization in Latvia is Association of Poles in Latvia (Związek Polaków na Łotwie).
See also
References
- ^ LR Centrālā statistikas pārvalde Accessed 2008-10-09
- ^ Ēriks Jēkabsons “Poles in Latvia”. The State Historical Archive of Latvia, 1999 Accessed 2008-10-09
- ^ LR Centrālā statistikas pārvalde Accessed 2008-10-09
- ^ LR Centrālā statistikas pārvalde Accessed 2008-10-09
